Interface Tour
Welcome to Querri! This guide walks you through the main areas of the interface so you can get comfortable navigating and finding what you need.
The Home Screen
Section titled “The Home Screen”When you first open Querri, you’ll see the Home screen. This is your starting point for all data analysis.
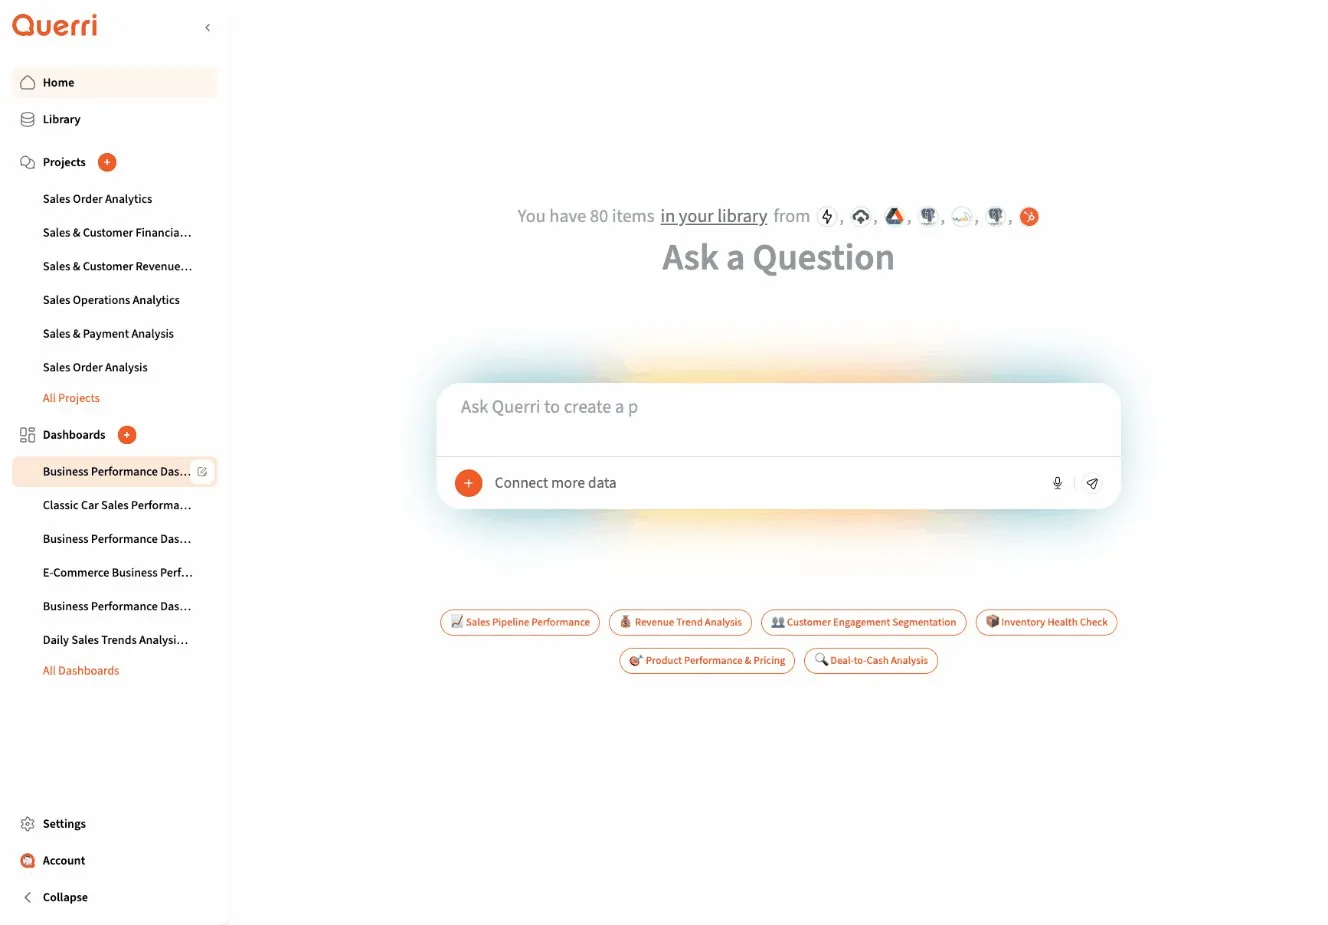
The Home screen gives you several ways to begin:
- Start typing below - Jump right in by asking a question about your data
- Select specific datasets - Choose exactly which data sources to work with
- Try a demo - Explore with sample data to learn how Querri works
The Sidebar Navigation
Section titled “The Sidebar Navigation”The left sidebar is your navigation hub. Here’s what each section does:
Returns you to the main starting screen where you can begin new analyses.
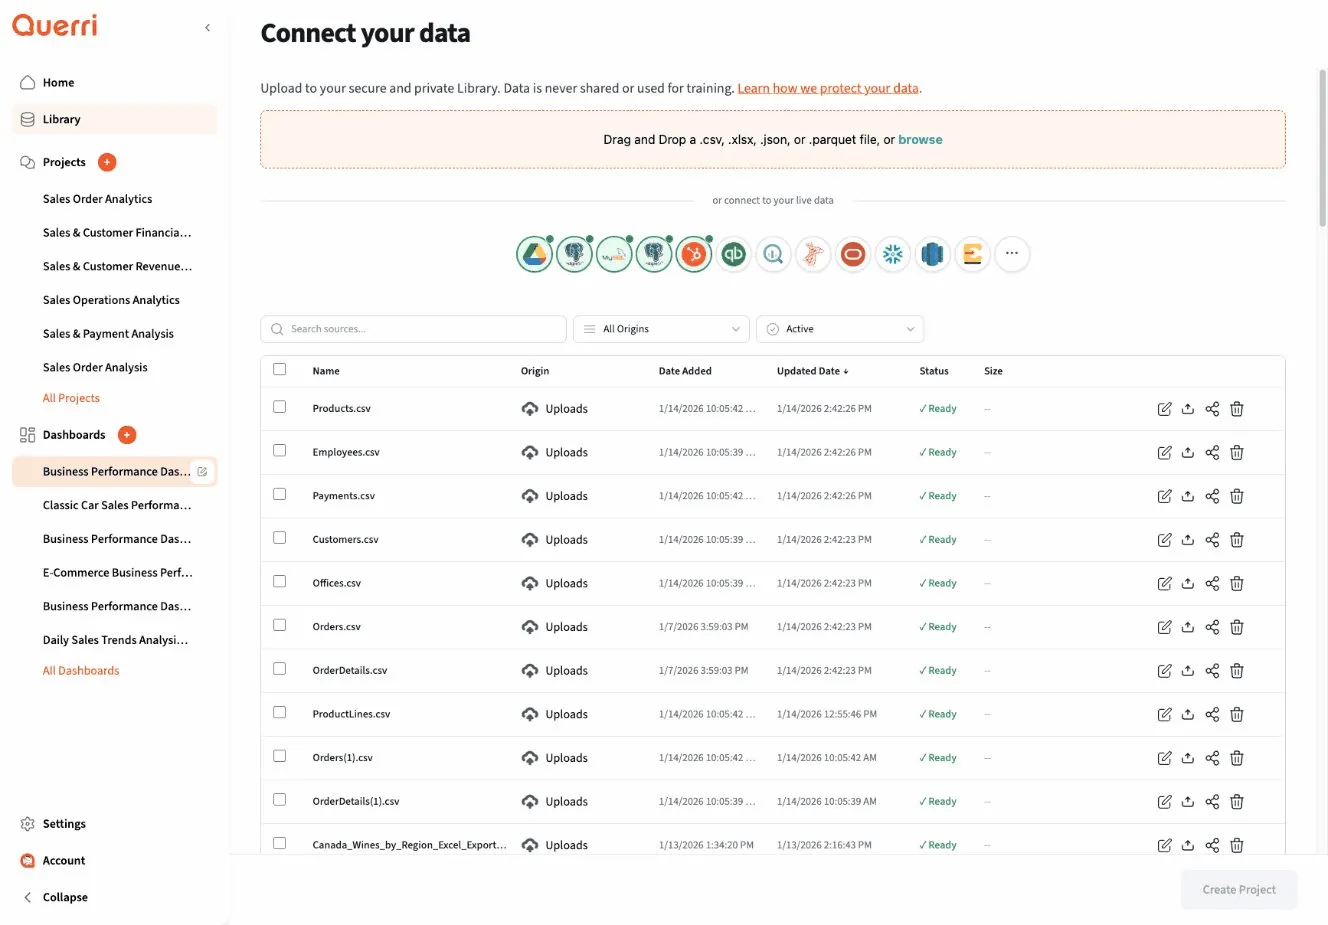
Library
Section titled “Library”Your data warehouse. This is where all your connected data sources live - uploaded files, database connections, and cloud integrations.
Projects
Section titled “Projects”Your analysis workspaces. Each project contains a conversation with Querri’s AI, along with all the data transformations, charts, and insights you’ve created.
Dashboards
Section titled “Dashboards”Collections of visualizations you’ve built. Dashboards let you combine multiple charts and tables into shareable views. See Dashboard Basics for details.
Working in a Project
Section titled “Working in a Project”When you’re inside a project, you’ll see:
- The Chat Area - Where you have a conversation with Querri about your data
- Results Cards - Tables and visualizations that appear as you work
- The Input Box - Where you type your questions and requests
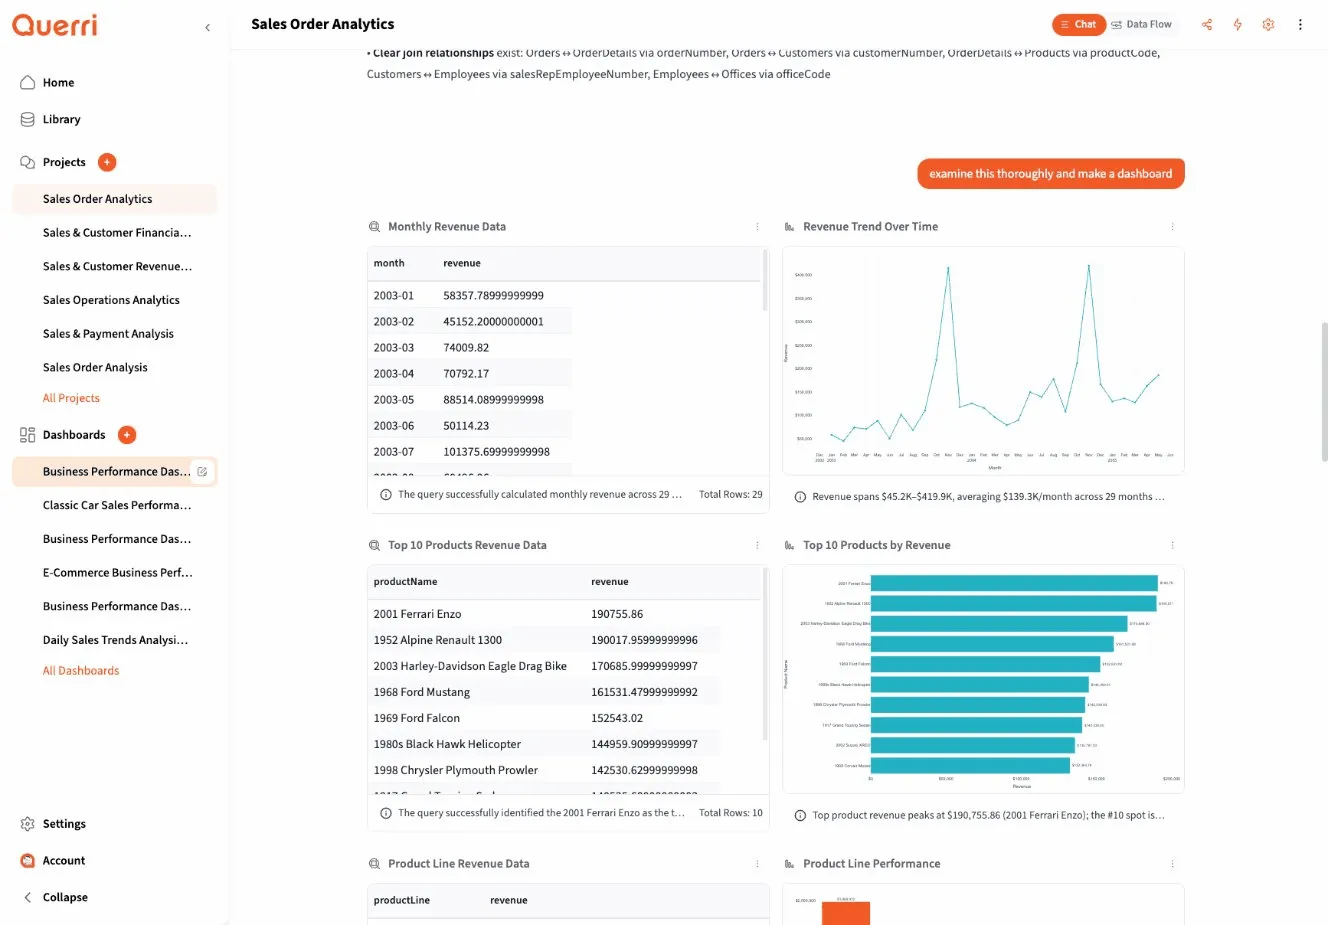
Each card in the results area represents a “step” in your analysis. Steps build on each other - filter your data, then aggregate it, then visualize it.
Key Interface Elements
Section titled “Key Interface Elements”The Chat Input
Section titled “The Chat Input”At the bottom of every project, you’ll find the chat input. This is where you:
- Ask questions about your data
- Request specific visualizations
- Ask Querri to explain what it found
- Connect additional data sources
Results Cards
Section titled “Results Cards”Each card shows either:
- Data tables - The actual rows and columns of your data
- Visualizations - Charts, graphs, and other visual representations
- Insights - AI-generated observations about patterns in your data
Action Buttons
Section titled “Action Buttons”Look for these common actions throughout the interface:
- Share - Send a project or dashboard to colleagues
- Automate - Schedule recurring analysis runs
- Download - Export data or visualizations
Tips for Getting Around
Section titled “Tips for Getting Around”- Use the sidebar to switch between major areas quickly
- Click any project name in the sidebar to jump directly to it
- The Home button always takes you back to start fresh
- Collapse the sidebar using the arrow icon if you need more screen space
Next Steps
Section titled “Next Steps”Now that you know your way around, try:
- Quick Start Guide - Complete your first analysis
- Using the Chat Interface - Master conversational data analysis
- Creating Visualizations - Build beautiful charts