Researcher Tool
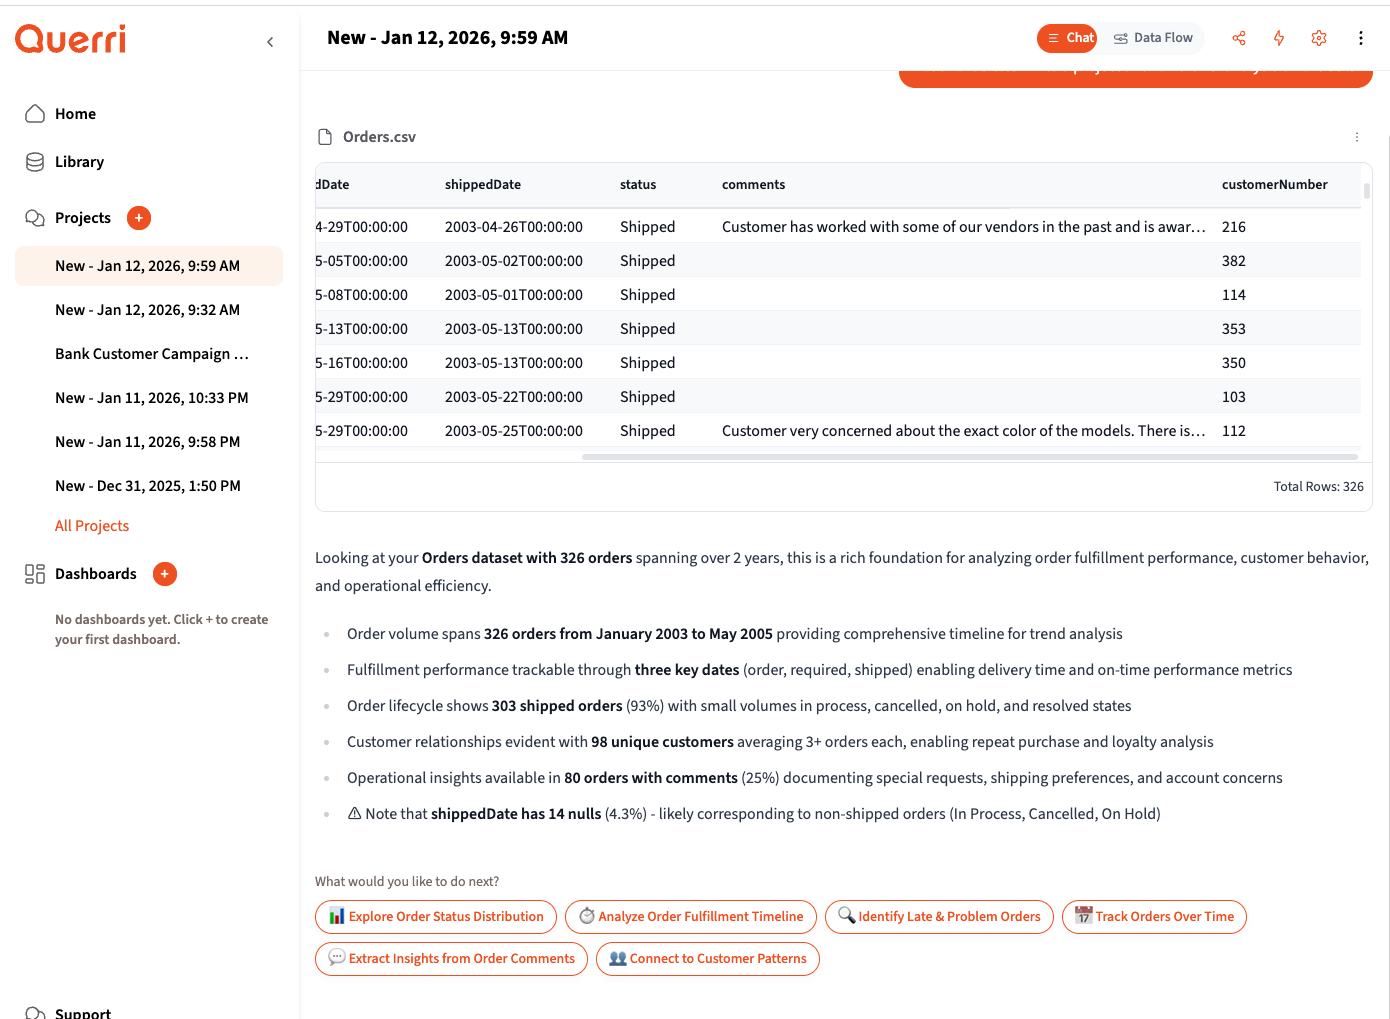
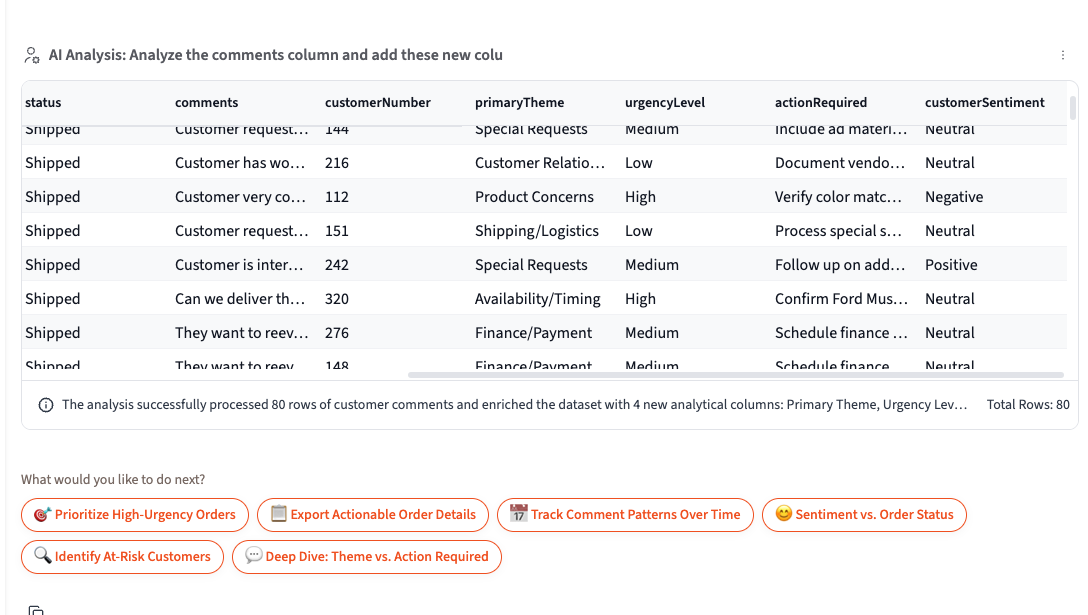
The Researcher tool uses AI to process each row of your data individually, transforming unstructured text into structured columns. It’s perfect for classification, entity extraction, sentiment analysis, and any task where you need to apply intelligent analysis to every record in your dataset.
What the Researcher Does
Section titled “What the Researcher Does”The Researcher applies an AI model to each row of your data to add new columns with computed values. Unlike standard transformations that use formulas, the Researcher understands context and can:
- Classify data into categories (industry, sentiment, priority level)
- Extract entities from text (company names, dates, amounts, locations)
- Standardize information (normalize company names, categorize products)
- Analyze sentiment or tone of text content
- Summarize or rewrite content in a consistent format
- Identify patterns that would be difficult to capture with rules
When to Use It
Section titled “When to Use It”Use the Researcher when you need to:
- Turn free-text fields into structured categories
- Extract specific information embedded in descriptions
- Classify or score items based on their content
- Clean and standardize messy text data
- Add intelligent metadata to your records
When NOT to Use It
Section titled “When NOT to Use It”The Researcher isn’t needed for:
- Simple calculations (use formulas instead)
- Lookups or joins (use standard data operations)
- Filtering based on exact values
- Aggregations and groupings
Understanding Row Limits and Processing Time
Section titled “Understanding Row Limits and Processing Time”Your subscription level determines how many rows you can process with the Researcher at once. The Researcher analyzes each row individually using AI, which means:
- Processing takes time — expect several minutes for larger datasets
- Costs scale with rows — each row uses AI processing capacity
- Results improve with focus — smaller, cleaner datasets often produce better classifications
How to Prompt for the Researcher
Section titled “How to Prompt for the Researcher”Simply describe what you want to extract or classify in natural language. The agent recognizes when your request requires row-by-row AI analysis and automatically invokes the Researcher.
Effective Prompts
Section titled “Effective Prompts”Classification:
- “Classify each company by industry”
- “Categorize these support tickets by priority: low, medium, high, critical”
- “Tag each review as positive, negative, or neutral”
- “Identify the business type for each vendor”
Extraction:
- “Extract the main technology mentioned in each company description”
- “Pull out any monetary amounts from the notes field”
- “Find the primary contact name in each record”
- “Extract all email addresses mentioned in the text”
Standardization:
- “Standardize the company names to their official names”
- “Normalize product categories into these buckets: Electronics, Clothing, Home, Food, Other”
- “Clean up the job titles to standard roles”
Analysis:
- “Score each customer review on a scale of 1-5”
- “Identify the main complaint theme for each support ticket”
- “Determine if each email is a sales inquiry, support request, or general question”
Be Explicit About Output Columns
Section titled “Be Explicit About Output Columns”The more specific you are about what columns you want and their values, the better results you’ll get.
Vague (might work):
- “Analyze these companies”
Better:
- “Add an ‘Industry’ column classifying each company”
Best — list your categories explicitly:
- “Add an ‘Industry’ column with one of: Technology, Healthcare, Finance, Retail, Manufacturing, Services, Other”
Request Multiple Columns at Once
Section titled “Request Multiple Columns at Once”Don’t run the Researcher multiple times when you can get everything in one pass:
Inefficient (3 separate runs):
"Classify each company by industry""Add a company size column""Extract the primary product"Efficient (1 run):
"Add these columns:- 'Industry': Technology, Healthcare, Finance, Retail, Manufacturing, Services, Other- 'Company_Size': Startup, SMB, Mid-Market, Enterprise- 'Primary_Product': The main product or service offered"This is faster, uses less processing capacity, and keeps your workflow clean.

Specify Value Formats
Section titled “Specify Value Formats”Tell the Researcher exactly what format you want:
- “Use title case for all values”
- “Return only single-word categories”
- “Use numbers 1-5, not words”
- “Format as ‘Yes’ or ‘No’”
- “Keep responses under 50 words”
The Two-Phase Workflow
Section titled “The Two-Phase Workflow”The Researcher uses a preview-then-execute workflow to help you validate results before processing your entire dataset.
Phase 1: Preview (30 Rows)
Section titled “Phase 1: Preview (30 Rows)”When you request a Researcher operation, the agent:
- Analyzes your data structure
- Creates an AI prompt for the task
- Processes 30 sample rows
- Shows you the results in a preview table
At this point, review the preview carefully:
- Are the new columns what you expected?
- Are the values accurate and consistent?
- Are there any obvious misclassifications?
Phase 2: Confirmation and Full Execution
Section titled “Phase 2: Confirmation and Full Execution”After reviewing the preview, you’ll see options like:
- “Run for all X rows” - Process your entire dataset
- “Filter first” - Reduce rows before processing
- “Cancel” - Start over with a different approach
Choose the option that makes sense based on your preview review.
Preparing Your Data for Best Results
Section titled “Preparing Your Data for Best Results”The quality of your Researcher results depends heavily on your input data. Follow these data science principles for optimal outcomes.
Reduce Row Count Before Processing
Section titled “Reduce Row Count Before Processing”Processing fewer rows is faster, cheaper, and often produces better results. Consider:
Filtering to relevant rows:
"Filter to customers from 2024 only, then classify by industry"Aggregating first:
"Group by company name first, then classify each unique company"Removing duplicates:
"Remove duplicate company names, then add industry classification"Ensure Relevant Columns Are Present
Section titled “Ensure Relevant Columns Are Present”The Researcher analyzes the content of your rows to make decisions. Make sure the columns containing the information needed for classification are included in your data.
For company classification:
- Company name
- Description or about text
- Website URL
- Products/services offered
For sentiment analysis:
- The actual text to analyze
- Optional: context like date or source
For entity extraction:
- The text field containing the entities
- Any contextual columns that help interpretation
Handle Missing Data First
Section titled “Handle Missing Data First”Empty or null values produce poor Researcher results. Before running the Researcher:
- Check for empty values: “How many rows have empty descriptions?”
- Filter them out: “Filter to rows where description is not empty”
- Or fill them: “Replace empty descriptions with ‘No description available‘“
Consolidate Text When Needed
Section titled “Consolidate Text When Needed”If the information you need to analyze is spread across multiple columns, consider combining them first:
"Combine the 'name', 'description', and 'notes' columns into a single 'full_text' column, then classify by industry"Tips for Better Classification Results
Section titled “Tips for Better Classification Results”Provide Category Examples
Section titled “Provide Category Examples”When you want specific categories, list them:
Good:
- “Classify into: SaaS, Hardware, Consulting, Other”
Even Better:
- “Classify into these categories:
- SaaS: Cloud software companies
- Hardware: Physical product manufacturers
- Consulting: Professional services firms
- Other: Anything else”
Use Consistent Granularity
Section titled “Use Consistent Granularity”Decide on the level of detail you need and stick to it:
Too granular:
- “Enterprise Cloud Infrastructure SaaS”
Too broad:
- “Technology”
Just right (for most use cases):
- “Cloud Services” or “SaaS”
Handle Ambiguous Cases
Section titled “Handle Ambiguous Cases”Tell the Researcher what to do with edge cases:
- “If unsure, classify as ‘Unknown’”
- “When a company spans multiple industries, use the primary one”
- “For conglomerates, use their largest business unit”
Tips for Better Extraction Results
Section titled “Tips for Better Extraction Results”Be Specific About What to Extract
Section titled “Be Specific About What to Extract”Vague:
- “Extract information from each row”
Specific:
- “Extract the founding year from each company description”
- “Find the CEO name mentioned in each press release”
- “Pull out all technology stack mentions (e.g., React, Python, AWS)“
Specify the Output Format
Section titled “Specify the Output Format”Tell the Researcher exactly how to format extracted data:
- “Extract as a comma-separated list”
- “Return only the first match”
- “Format dates as YYYY-MM-DD”
- “Use ‘N/A’ if not found”
Handle Multiple Matches
Section titled “Handle Multiple Matches”Clarify what to do when multiple values exist:
- “Return all matches as a comma-separated list”
- “Return only the first occurrence”
- “Return the most recent date”
- “Return the largest amount”
Data Science Best Practices
Section titled “Data Science Best Practices”Sample Size Considerations
Section titled “Sample Size Considerations”For classification tasks:
- 50-100 rows is usually enough to validate your approach works
- 500+ rows gives statistically meaningful results for analysis
- 1,000+ rows should use filtering/aggregation first when possible
Feature Engineering
Section titled “Feature Engineering”Consider adding columns that help the AI make better decisions:
For company classification:
- Company website domain (helps identify industry)
- Employee count range (helps identify company size category)
- Geographic region (helps with regional business patterns)
For sentiment analysis:
- Text length (very short text is harder to classify)
- Source type (support tickets vs. reviews have different patterns)
- Date (sentiment patterns may vary over time)
Validation Strategies
Section titled “Validation Strategies”After running the Researcher:
- Spot-check results: “Show me 20 random rows with the new classification”
- Check distributions: “Count how many rows are in each category”
- Examine edge cases: “Show me rows classified as ‘Other’ or ‘Unknown’”
- Verify accuracy: Manually check 10-20 random classifications
Iterative Refinement
Section titled “Iterative Refinement”If results aren’t quite right:
- Review misclassifications: “Show me rows where industry is ‘Other’”
- Refine your prompt: Add more specific category definitions
- Re-run with improvements: “Re-classify industry using these updated categories…”
Real-World Examples
Section titled “Real-World Examples”Example 1: Classifying Companies by Industry
Section titled “Example 1: Classifying Companies by Industry”Starting data: 5,000 companies with name and description
Step 1: Reduce data
"Remove duplicate company names based on the name column"Result: 3,200 unique companies
Step 2: Filter empty descriptions
"Filter to companies where description is not empty"Result: 2,800 companies
Step 3: Run Researcher
"Add an 'Industry' column classifying each company into:Technology, Healthcare, Financial Services, Retail, Manufacturing,Professional Services, or Other. Base the classification on thecompany name and description."Step 4: Validate
"Show me the count of companies in each industry"Example 2: Extracting Entities from Support Tickets
Section titled “Example 2: Extracting Entities from Support Tickets”Starting data: 10,000 support tickets with subject and body
Step 1: Focus on recent tickets
"Filter to tickets from the last 30 days"Result: 1,200 tickets
Step 2: Run Researcher
"Add these columns:- 'Category': Bug, Feature Request, How-To Question, Account Issue, Other- 'Product_Area': Which product area is affected- 'Urgency': Low, Medium, High, Critical based on the language used"Step 3: Analyze results
"Create a bar chart showing ticket count by Category and Urgency"Example 3: Sentiment Analysis of Reviews
Section titled “Example 3: Sentiment Analysis of Reviews”Starting data: 8,000 product reviews
Step 1: Aggregate by product
"First, let me see how many reviews per product"Step 2: Sample if needed
"Filter to the top 20 products by review count"Result: 2,400 reviews
Step 3: Run Researcher
"Add a 'Sentiment' column with values: Positive, Neutral, Negative.Also add a 'Main_Theme' column identifying the primary topic discussed."Step 4: Visualize
"Show a stacked bar chart of sentiment by product"Troubleshooting
Section titled “Troubleshooting””My classifications are inconsistent”
Section titled “”My classifications are inconsistent””Cause: The prompt is too vague or categories overlap. Fix: Be more explicit about category definitions and edge cases.
”Processing is taking too long”
Section titled “”Processing is taking too long””Cause: Too many rows being processed. Fix: Filter, aggregate, or deduplicate your data first.
”I’m getting ‘ERROR’ in result columns”
Section titled “”I’m getting ‘ERROR’ in result columns””Cause: The AI couldn’t parse the row content or the prompt was unclear. Fix: Check for malformed data and simplify your extraction request.
”Results don’t match what I expected”
Section titled “”Results don’t match what I expected””Cause: The preview looked good but full results differ. Fix: The 30-row preview is a sample. Run validation queries on the full results and iterate.
Next Steps
Section titled “Next Steps”- Learn about the Forecaster Tool — for time series predictions
- Learn How to Connect Your Data — joining, stacking, and combining datasets
- Review Prompting Best Practices for general tips