February 2026
February 18th
Section titled “February 18th”The Querri Public API v1 reaches feature completeness with Round 2. This release adds external user IDs, project and chat management, real-time chat streaming, granular sharing controls, usage tracking, and several security and consistency improvements. All endpoints are authenticated via qk_ API keys with scoped permissions.
What’s New
Section titled “What’s New”External User IDs
Section titled “External User IDs”Map your application’s user identifiers to Querri users. External IDs let you reference users by your own IDs across all API endpoints — embedding, sharing, project ownership, and chat — without needing to know Querri’s internal user IDs.
- Transparent resolution — pass an external ID anywhere a
user_idis accepted and Querri resolves it automatically - Immutable mapping — once set, an external ID cannot be reassigned to a different user
- Validation — alphanumeric characters plus
-_.:, up to 255 characters - Scopes —
admin:users:read,admin:users:write
Project Management
Section titled “Project Management”Create and delete projects programmatically. Projects are the core organizational unit in Querri — each project contains steps, data flows, and chat conversations.
POST /v1/projects— create a project with a name, description, and owner user IDGET /v1/projects— list projects with cursor paginationGET /v1/projects/{id}— get project detail with step summariesDELETE /v1/projects/{id}— delete a project and clean up associated resources (dashboard widgets, authorization grants, Redis streams)- Scopes —
admin:projects:read,admin:projects:write
Chat & Streaming
Section titled “Chat & Streaming”Create chat conversations within projects and stream AI responses in real time via Server-Sent Events.
POST /v1/projects/{id}/chats— create a new chat conversationGET /v1/projects/{id}/chats— list chats with message countsDELETE /v1/projects/{id}/chats/{id}— delete a chatPOST /v1/projects/{id}/chats/{id}/stream— send a prompt and receive a streaming SSE responseGET /v1/projects/{id}/chats/{id}/stream— resume or replay an in-progress streamPOST /v1/projects/{id}/chats/{id}/cancel— cancel a running stream- Distributed locking — prevents concurrent streams on the same chat
- Scopes —
admin:projects:read,admin:projects:write
Sharing Endpoints
Section titled “Sharing Endpoints”Grant and revoke access to projects and dashboards for specific users via the API.
POST /v1/sharing/projects/{id}/share— share a project with a userPOST /v1/sharing/projects/{id}/revoke— revoke a user’s project accessPOST /v1/sharing/dashboards/{id}/share— share a dashboard with a userPOST /v1/sharing/dashboards/{id}/revoke— revoke a user’s dashboard access- All sharing endpoints support external user IDs
- Scopes —
sharing:read,sharing:write
Usage Tracking
Section titled “Usage Tracking”Monitor API consumption and rate limit status.
GET /v1/usage— current period usage summaryGET /v1/usage/history— historical usage data with date range filtering- Scopes —
usage:read
Improvements
Section titled “Improvements”| Area | Change |
|---|---|
| Embed Security | Session creation now validates user IDs and resolves external IDs before issuing tokens |
source_scope Rename | The source_scope field on data policies is renamed to scope for consistency. This is a breaking change on the public API; existing MongoDB documents are migrated transparently |
| Audit Logging | All write operations (project create/delete, chat create/delete, sharing changes) emit structured audit events with API key attribution |
| Error Responses | All new endpoints use Stripe-style structured errors with type, code, message, and doc_url fields |
| Rate Limiting | X-RateLimit-Limit, X-RateLimit-Remaining, and X-RateLimit-Reset headers on all responses |
Release Date: February 18, 2026
February 13th
Section titled “February 13th”This is a major update to outputs and sharing. The Dashboard Builder graduates from beta to a fully-featured layout engine with advanced controls, sharing, and embedding. Wrapped brings AI-generated presentations to your data. The Embed SDK and white-label configurator make it easy to integrate Querri into any application. And new connectors, Excel improvements, and stability work round out the release.
What’s New
Section titled “What’s New”Dashboard Builder
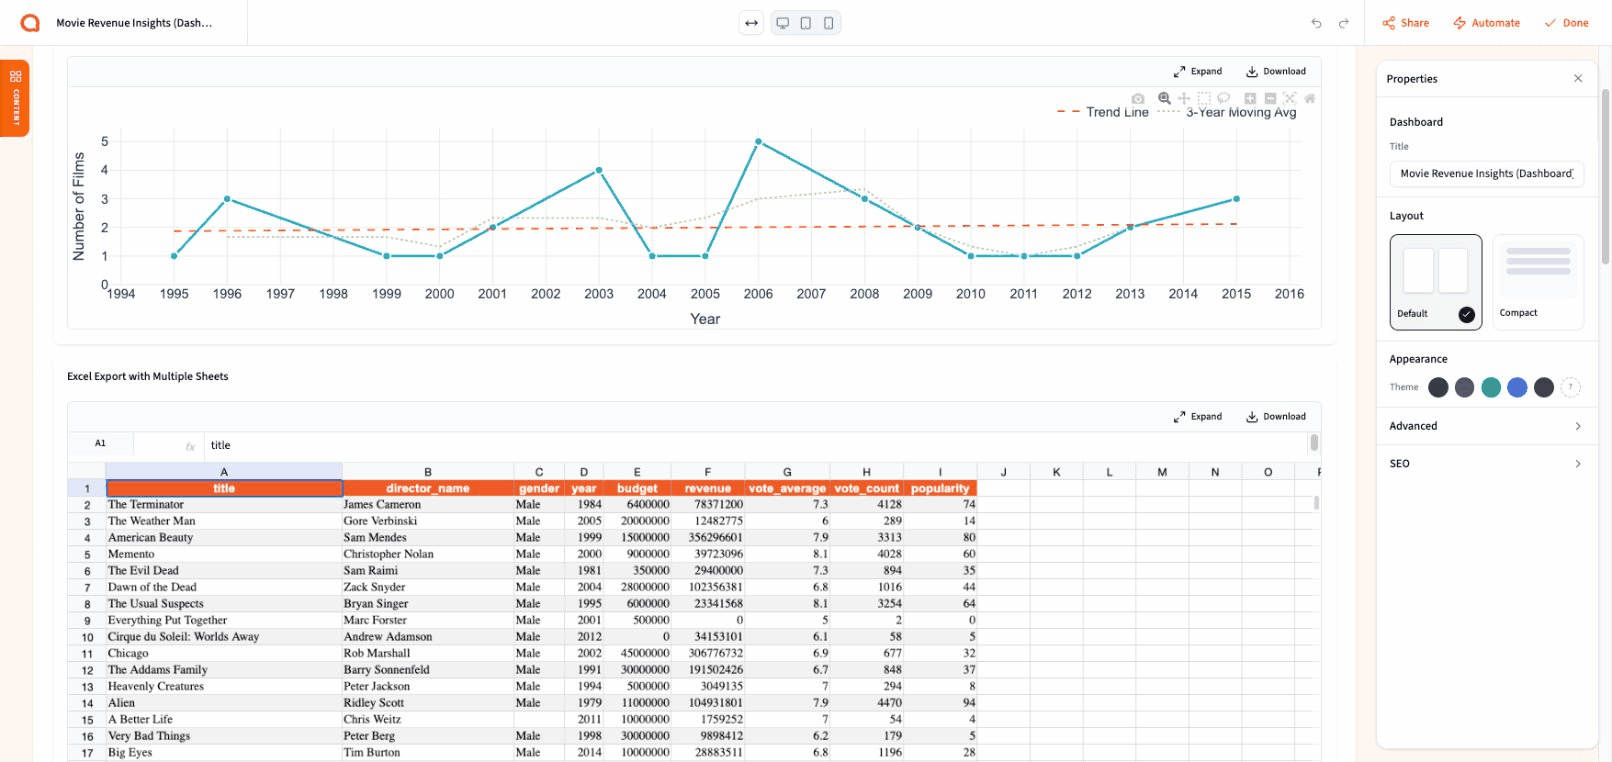
Section titled “Dashboard Builder”The Dashboard Builder is now a complete, production-grade tool for creating interactive dashboards from your analysis results. With 200+ commits in this release cycle, the builder has been transformed from a beta preview into a powerful layout engine.
Widget Types
Section titled “Widget Types”Build dashboards from a rich set of components:
- Interactive Charts — Plotly-powered charts with zoom, pan, hover tooltips, annotations, and download options. Charts pull live data from your project steps and can be refreshed on demand or on a schedule.
- Data Tables — Virtualized tables with pagination, resizable columns, sticky row numbers, and sorting. Tables handle large datasets smoothly with 250-row pages and infinite scroll.
- Rich Text — A full WYSIWYG editor (Lexical-based) for adding narrative, commentary, and formatting directly in your dashboard. Add multiple text blocks and position them anywhere in the layout.
- Images — Static images and SVG exports from your charts. Auto-height sizing keeps images crisp without manual adjustment.
- Spacers — Control whitespace and visual breathing room between sections.
- Section Headers — Organize your dashboard into labeled sections with configurable sizing.
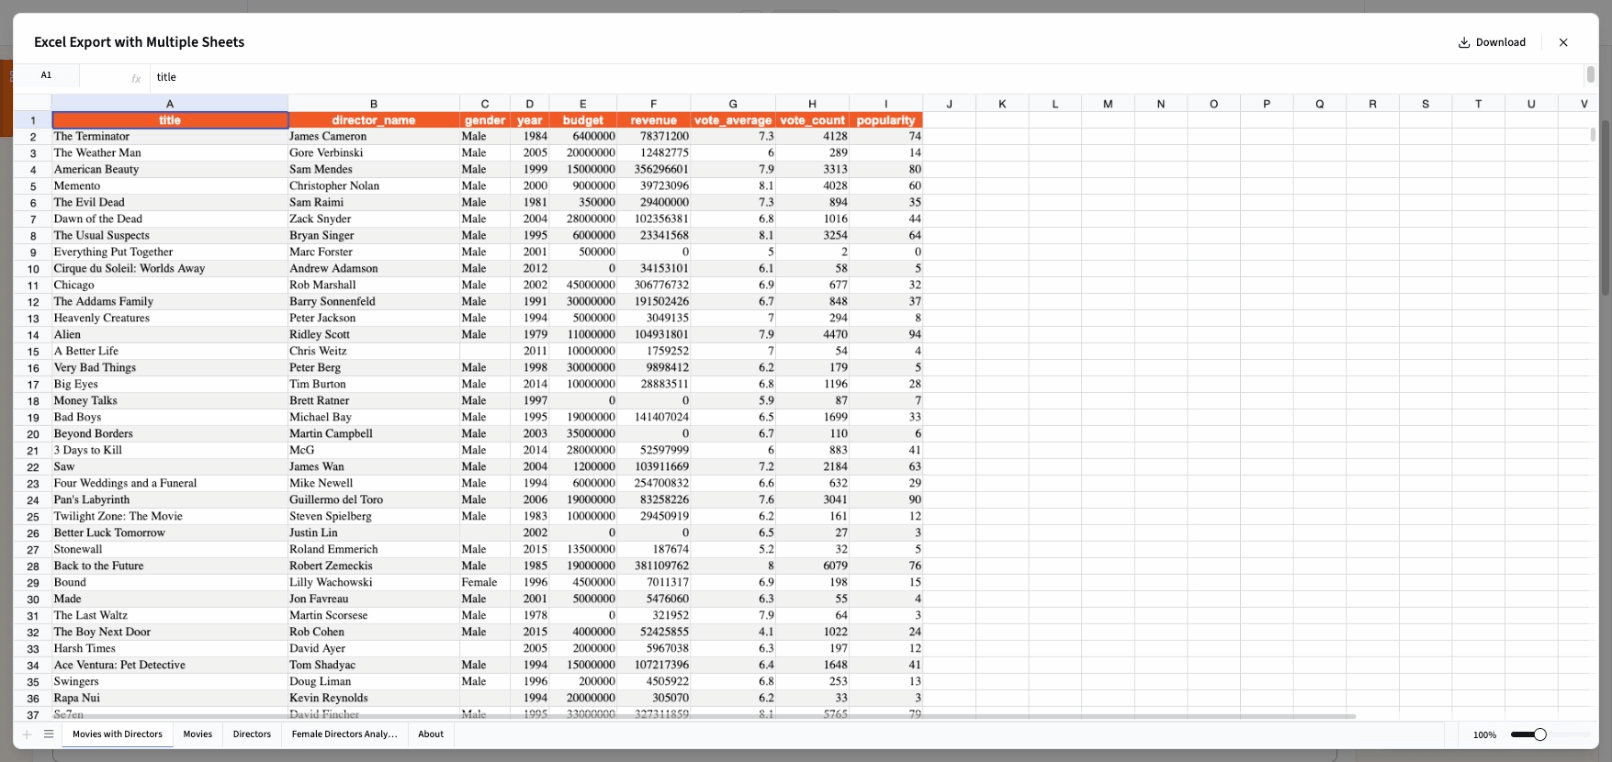
- Excel Exports — Embed spreadsheet data directly as a dashboard widget with read-only viewing.
Drag-and-Drop Layout
Section titled “Drag-and-Drop Layout”The canvas supports a flexible row-based layout with intuitive controls:
- Drag widgets from the sidebar onto the canvas with visual drop zone indicators
- Resize widgets horizontally by dragging column edges, with automatic neighbor adjustment
- Resize rows vertically with drag handles that snap to content
- Reorder widgets within and across rows
- Column span controls for responsive layouts across desktop, tablet, and mobile viewports
Properties Panel
Section titled “Properties Panel”Select any widget to open its properties in a floating side panel:
- Widget title overrides
- Width and height controls with drag-to-scrub number inputs
- Padding and gap adjustments
- Card style toggle for bordered widget containers
- Canvas background and grid customization
- Dashboard-wide max-width control (full-width or constrained)
Auto-Save & Version History
Section titled “Auto-Save & Version History”Your work is always protected:
- Auto-save — changes are persisted automatically as you edit
- Undo/Redo — debounced history snapshots let you step back through changes
- Recovery — if the browser closes unexpectedly, your last state is restored on reload
Responsive Preview
Section titled “Responsive Preview”Preview how your dashboard looks at different screen sizes using the viewport controls in the builder header. Switch between Desktop, Tablet, and Mobile views to fine-tune your layout for every audience.
Sharing & SEO
Section titled “Sharing & SEO”Dashboards now have a full sharing system with link-based access, password protection, and social media previews.
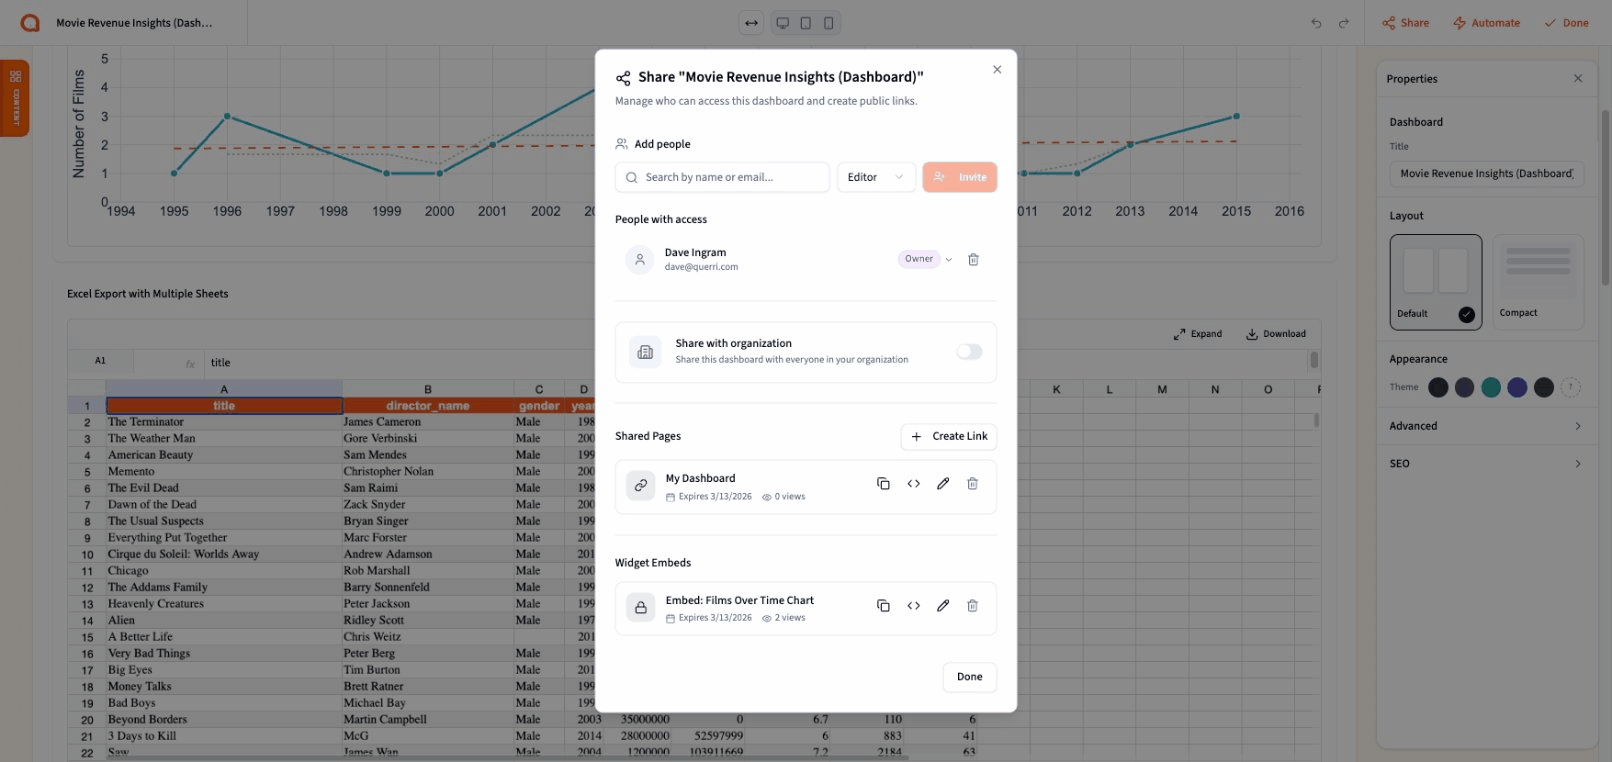
- Public share links — generate a read-only link anyone can view without logging in
- Password protection — optionally require a password before viewers can access shared dashboards or individual widgets
- SEO & Open Graph — shared dashboards include meta tags, Open Graph images (1200x630), and Twitter Card support so links look great when shared on social media, Slack, or email
- Per-widget sharing — share or embed individual charts and tables from your dashboard, not just the whole thing
- Header controls — configure which UI elements (navigation, branding) appear on shared views
Widget Embedding
Section titled “Widget Embedding”Individual dashboard widgets can be embedded independently. From the share modal, select any chart, table, or widget and get an embed code with its own share key. Password protection carries through to embedded widgets, and the embed respects the same read-only access controls as the full dashboard.
Wrapped — AI-Generated Presentations
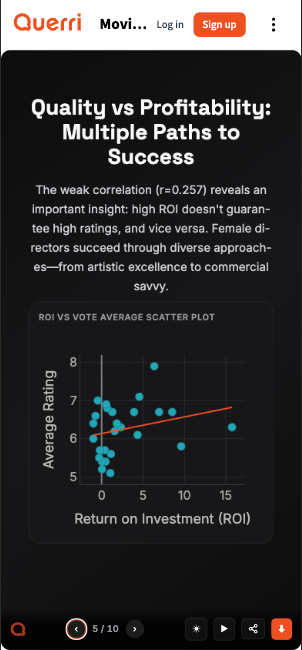
Section titled “Wrapped — AI-Generated Presentations”Querri can now generate polished, multi-slide presentations from your data. Ask the AI to create a presentation about your analysis and it produces a complete deck with charts, metrics, and narrative — ready to present or share.

What you get:
- 25 slide templates — title slides, metric cards, comparison views, timelines, journey milestones, quote highlights, bullet summaries, takeaways, and more
- 4 Plotly chart variants — area, line, bar, and donut charts rendered directly in slides with full interactivity
- Three viewing modes — inline thumbnail preview, expanded full-height view with navigation, or fullscreen 16:9 presentation mode
- Theming — presentations inherit your brand colors and support dark/light mode switching
- Export — download as PDF or PowerPoint for use outside Querri
- Navigation — keyboard shortcuts, swipe gestures, and slide thumbnail strip for quick navigation
- Animations — configurable animation tiers (none, basic, full) with smooth slide transitions
Presentations are fully responsive and mobile-friendly. Slides adapt to any screen size with touch-friendly swipe navigation, so your data story looks great whether you’re presenting from a laptop or sharing a link someone opens on their phone.
Presentations are generated through a multi-step agentic pipeline that plans the narrative, generates slides in parallel, validates the output, and stores the result. The entire process streams progress updates so you can watch your presentation come together.
Embed SDK & White-Label Integration
Section titled “Embed SDK & White-Label Integration”Querri now provides a complete embedding system for integrating dashboards, projects, and views into external applications. The Embed SDK is a zero-dependency vanilla JavaScript library (~4KB minified) that handles authentication, theming, and bidirectional communication through a secure, sandboxed iframe.
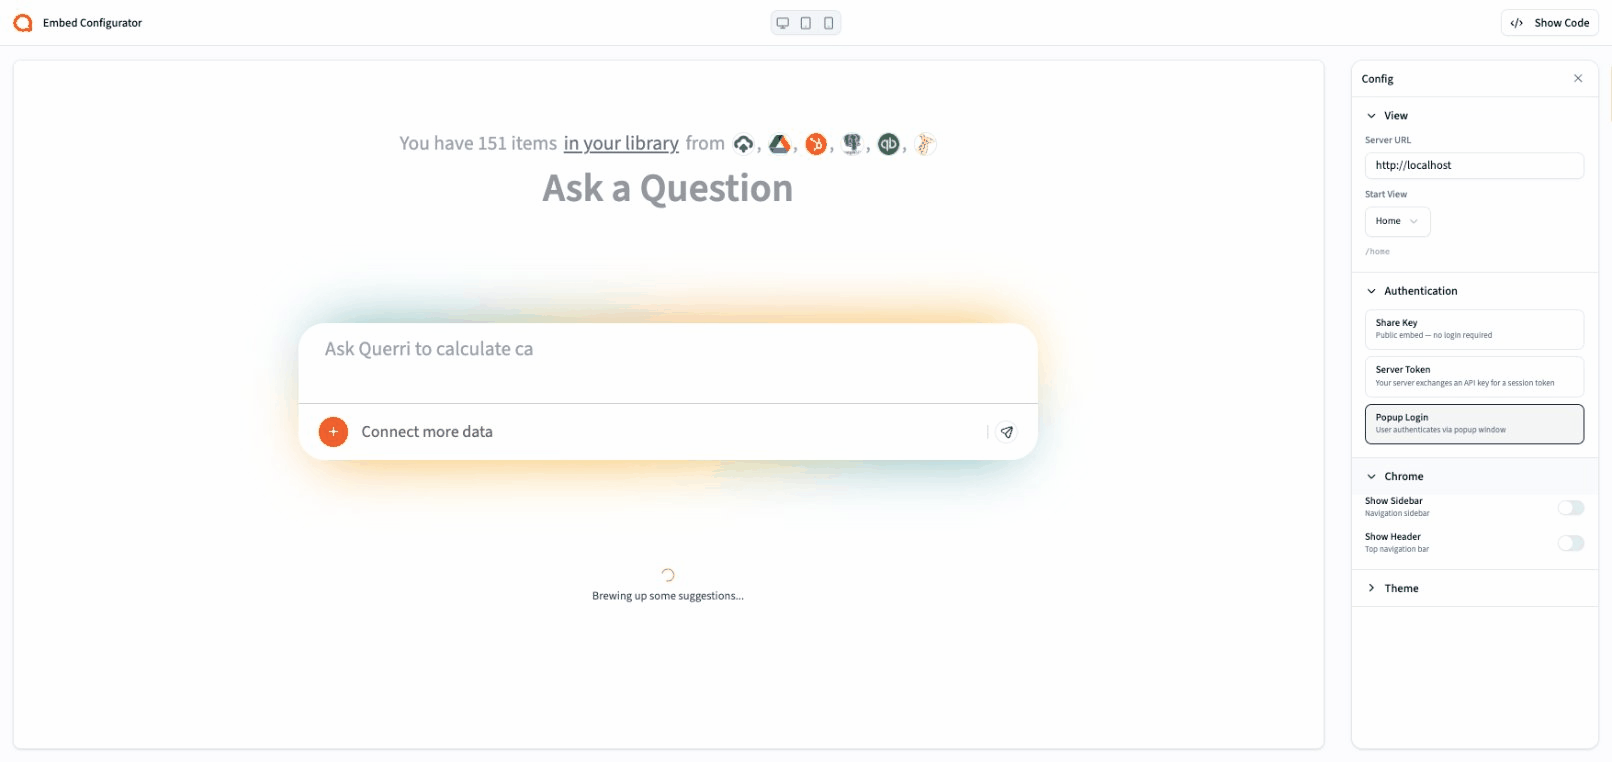
Three Authentication Modes
Section titled “Three Authentication Modes”- Share Key — for public embeds. No server-side code required. Ideal for marketing pages, public reports, and read-only dashboards.
- Server Token — for enterprise and white-label scenarios. Your backend exchanges an API key for a scoped session token. Supports per-user identity with role-based access control and 24-hour sessions with auto-refresh.
- Popup Login — for internal tools where users have Querri accounts. Users authenticate via a popup window with SSO support. Tokens are cached for seamless return visits.
Embed UI Configurator
Section titled “Embed UI Configurator”The new Embed UI page at /builder/embedui provides an interactive configurator for setting up embeds:
- Select authentication mode and enter credentials
- Choose which Querri view to embed (dashboard, project, or any route)
- Toggle chrome options (sidebar visibility, header elements)
- Apply custom theme colors via CSS custom properties
- Live preview updates as you configure
- Copy-ready embed code with all settings baked in
Developer Features
Section titled “Developer Features”- Multiple embeds per page — each
QuerriEmbed.create()call creates an independent instance - Event system — listen for
ready,error,session-expired, andnavigationevents - API key management — create, list, and revoke API keys via REST endpoints
- Security — origin verification, iframe sandboxing,
referrerpolicy="strict-origin", CSP support, and credential isolation between parent page and iframe
Enhanced White-Label Offering
Section titled “Enhanced White-Label Offering”The Embed SDK powers Querri’s white-label capabilities. Organizations can embed any or all of Querri’s features — data analysis, dashboards, presentations, the chat interface — into their own applications with full control over branding and user experience. Server Token authentication enables per-user access scoping through your existing identity provider, and theme customization ensures the embedded experience matches your brand.
Contact sales to discuss white-label pricing and integration support.
Excel Viewer Enhancements
Section titled “Excel Viewer Enhancements”The built-in Excel viewer received significant improvements for fidelity and performance:
- High-fidelity rendering — cell colors, borders, alignment, number formatting, and “general” alignment mode are now accurately reproduced
- Progress updates — large spreadsheets show real-time conversion progress via server-sent events as they process
- Improved performance — XLSX conversion is faster with better timeout handling for very large files (up to 100MB)
- Formula cell alignment — cells with formulas now display with correct horizontal alignment
- Color support in number formatting — conditional color formatting in Excel cells carries through to the viewer
- Merged cell fix — resolved an attribute error when exporting files with merged cells
- Dashboard integration — Excel files can be embedded as read-only widgets in dashboards
New Connectors (Early Release)
Section titled “New Connectors (Early Release)”Salesforce
Section titled “Salesforce”Connect your Salesforce instance to Querri and analyze CRM data alongside your other sources. The Salesforce connector is available as an early release — contact us if you’d like to start using it before the full release.
Amazon Redshift
Section titled “Amazon Redshift”Query Amazon Redshift data warehouses directly from Querri. The connector uses DuckDB’s postgres_scanner for reliable, high-performance access to your Redshift clusters. The Redshift connector is available as an early release — contact us if you’d like to start using it before the full release.
Usability & Quality of Life
Section titled “Usability & Quality of Life”Smarter Suggestions
Section titled “Smarter Suggestions”Chat suggestions are now generated in parallel with the agent’s response instead of pre-warming at chat start. This cuts output tokens by ~60% with simplified prompts that produce short, focused labels. Redis coordination prevents duplicate generation across concurrent requests.
Asset Management
Section titled “Asset Management”Logo and brand image uploads are now handled through a dedicated asset management system. Organizational assets have their own CRUD endpoints and no longer appear as file sources in the Library, keeping your data sources clean and organized.
Plotly Chart Improvements
Section titled “Plotly Chart Improvements”- Smoother chart animations with improved transition handling
- Fixed 401 errors on shared dashboards by using embed context headers for chart data requests
Builder UX Polish
Section titled “Builder UX Polish”- Collapsible floating panel buttons for a cleaner editing experience
- Improved drag cancellation and token refresh handling
- Better sidebar component styling and panel layering
- Viewport controls in the builder header for responsive preview
- Dashboard name syncs to sidebar immediately after save
- Rich text editor properly resizes within dashboard widgets
Reliability & Performance
Section titled “Reliability & Performance”| Area | Improvement |
|---|---|
| XLSX Conversion | More robust handling with better timeout management and stale key cleanup on startup |
| Share Links | Fixed builder share links broken in production; improved password handling flow |
| Drag & Drop | Better zone detection, column edge alignment, and grid boundary calculations |
| Dashboard Layout | Corrected widget height calculations, improved column span responsiveness |
| Rich Text Editor | Fixed reactivity issues with visibility and external content sync in TipTap |
| Suggestions | Parallel generation with SETNX coordination eliminates duplicate work |
| Embed Sessions | Per-user session tokens with proper scope isolation |
Bug Fixes
Section titled “Bug Fixes”| Area | Fix |
|---|---|
| Excel Export | Fixed merged cell attribute error during export |
| Share Links | Fixed share links broken in production for builder dashboards |
| Plotly Charts | Fixed 401 authentication errors on shared/embedded dashboards |
| Rich Text Editor | Fixed external content sync and reactivity issues |
| Dashboard Heights | Corrected widget height calculations across multiple widget types |
| Presentation Heights | Fixed height rendering for Wrapped presentations in various contexts |
| Dev Server | Fixed logging bug in development server |
| Streaming | Fixed streaming bug for OG image generation |
| Source Reprocessing | Updating a source now correctly triggers reprocessing |
Release Date: February 13, 2026
February 6th
Section titled “February 6th”This update focuses on making Querri more transparent while it works, giving you new ways to interact with results, and improving reliability across the board.
What’s New
Section titled “What’s New”Live Status Updates
Section titled “Live Status Updates”Querri now shows you what it’s doing while it works. During longer analyses, you’ll see real-time status indicators — Thinking, Analysing, Executing — so you always know where things stand. The reasoning panel also shows a summary when collapsed, letting you glance at Querri’s approach without expanding the full view.
Message Actions
Section titled “Message Actions”Every AI response now includes quick actions right on the message:
- Rerun — not happy with a response? Regenerate it with one click, no need to retype your prompt
- Share — send a result to a colleague via email or social media, with formatting preserved
- Copy — copy with rich text formatting for pasting into documents or presentations
Action buttons show animated hover effects for a more responsive feel.
Excel Viewer & Enhancements
Section titled “Excel Viewer & Enhancements”Working with Excel files in Querri got a significant upgrade:
- Built-in XLS viewer for previewing spreadsheet data directly in Querri
- Faster processing of large Excel files with progress updates as they load
- Formula support in Excel exports
- Improved sharing experience for spreadsheet outputs
Faster Refine
Section titled “Faster Refine”The Refine experience is now faster, with an improved approach that delivers results more quickly when tweaking individual steps.
Usability Enhancements
Section titled “Usability Enhancements”Connectors & Data Sources
Section titled “Connectors & Data Sources”Connecting to your data is now faster and more reliable:
- Instant connector loading — connector data is cached so pages load immediately, with updates happening in the background
- Safari OAuth fix — connecting accounts via OAuth now works reliably in Safari
- Better error messages — clearer feedback when something goes wrong during connection setup
- Connector status stays accurate after connecting, disconnecting, or toggling sources
Library
Section titled “Library”- Table previews when browsing sources in the Library
- Support for multi-table sources like Excel files with multiple sheets
- New download options including per-tab downloads
Projects & Dashboards
Section titled “Projects & Dashboards”- Inline project renaming — click the project title in the header to rename it directly, no more opening a modal
- Smarter sidebar ordering — dashboards and projects stay in place instead of jumping around
- Dashboard widgets can now be resized horizontally and vertically
Step Renaming
Section titled “Step Renaming”Renaming a step now updates instantly with a loading indicator, instead of waiting for the server to confirm before showing the new name.
Examine
Section titled “Examine”The Examine tool is noticeably faster, with improved data loading and smarter query handling for large datasets.
Querri now automatically chooses the right map type — choropleth for regional data, point maps for locations — based on your data.
Reliability & Performance
Section titled “Reliability & Performance”Chat Streaming
Section titled “Chat Streaming”The real-time chat experience received extensive reliability improvements:
- Stale connection detection — if your connection silently drops, Querri detects it and reconnects automatically
- Smarter reconnection — if reconnection attempts fail, Querri monitors your network and retries when connectivity is restored
- Seamless resume — when reconnecting, any missed content is replayed so you don’t lose anything
- Better error handling — transient network issues are retried silently; only real problems surface as errors
General Stability
Section titled “General Stability”- Files still uploading can no longer be accidentally deleted or renamed
- Fixed an issue where navigating away during project creation could cause errors
- Sign-out now reliably clears all session data
- After a Querri update, you’ll see a friendly prompt to reload rather than encountering errors from stale code
- Improved responsive layout for file tables on smaller screens and tablets
Bug Fixes
Section titled “Bug Fixes”| Area | Fix |
|---|---|
| Google Sheets | Fixed an issue where some Google Sheets wouldn’t load correctly |
| QuickBooks | General Ledger reports are available again |
| File table | Fixed unnecessary scrollbars and improved column sizing on small screens |
| Chat | Fixed cases where the chat could appear stuck after a network interruption |
| Dropdowns | Improved accessibility and fixed menus not closing after selection |
| Project title | Fixed inconsistent behavior when editing project names |
| Restore | Prevented accidental double-clicks during message restore |
| Tablet | Fixed prompt panel sizing on tablet displays |
Release Date: February 6, 2026