January 2026
Querri’s January 2026 release represents a major evolution of the platform with over 450 commits introducing new features, significant performance improvements, and enhanced user experience across the entire application.
What’s New
Section titled “What’s New”Agentic File Preprocessing
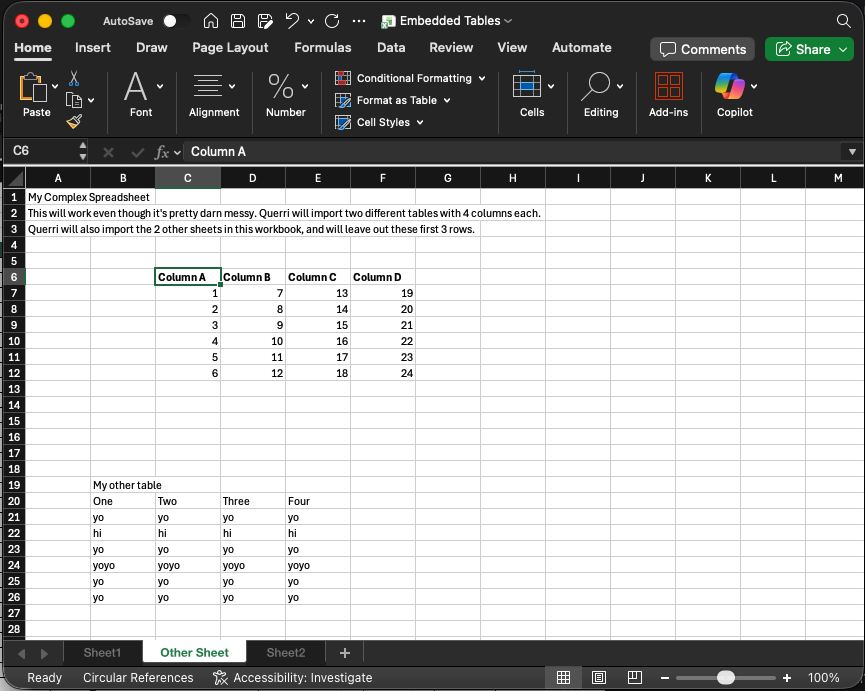
Section titled “Agentic File Preprocessing”Uploaded files now “just work” in far more cases. A new AI-powered preprocessing system automatically detects and handles the formatting quirks common in real-world data exports.
What gets handled automatically:
- Metadata rows and report headers at the top of files
- Footer rows with totals and summaries
- Non-standard delimiters (tabs, semicolons, pipes)
- Blank rows and columns scattered throughout
- Multiple tables embedded in a single Excel sheet
- JSON data nested inside wrapper objects
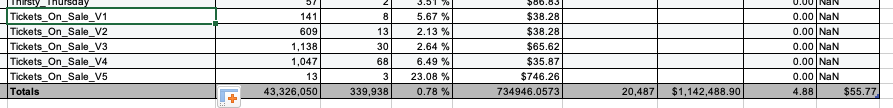
Footer detection is especially important for accurate analysis. When report exports include “Totals” rows, including them in a sum or average would double-count your data. Querri now automatically identifies and excludes these summary rows.
The preprocessing results are cached, so subsequent loads are instant. Files that previously required manual cleanup now load correctly on first upload.
Table Improvements
Section titled “Table Improvements”Data tables now include powerful new column controls for sorting and formatting.
Column Sorting
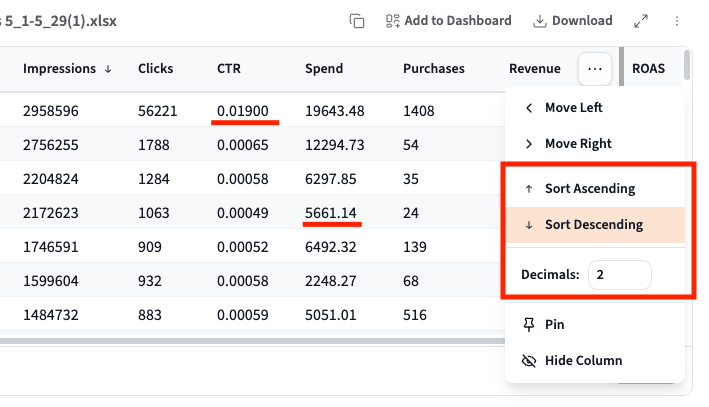
Click any column header menu to sort your data ascending or descending. No more needing to ask the AI to sort your results—just click and sort directly from the table UI.
Decimal Precision Control
A long-awaited feature: you can now control decimal places per column. Click the column menu and adjust the “Decimals” setting to show exactly the precision you need—whether that’s whole numbers for counts or five decimal places for rates and percentages. Your preferences are preserved as you work with the data.
Additional Column Controls
- Move Left / Move Right - Reorder columns without re-running your analysis
- Pin - Keep important columns visible while scrolling
- Hide Column - Temporarily hide columns you don’t need
Project List Enhancements
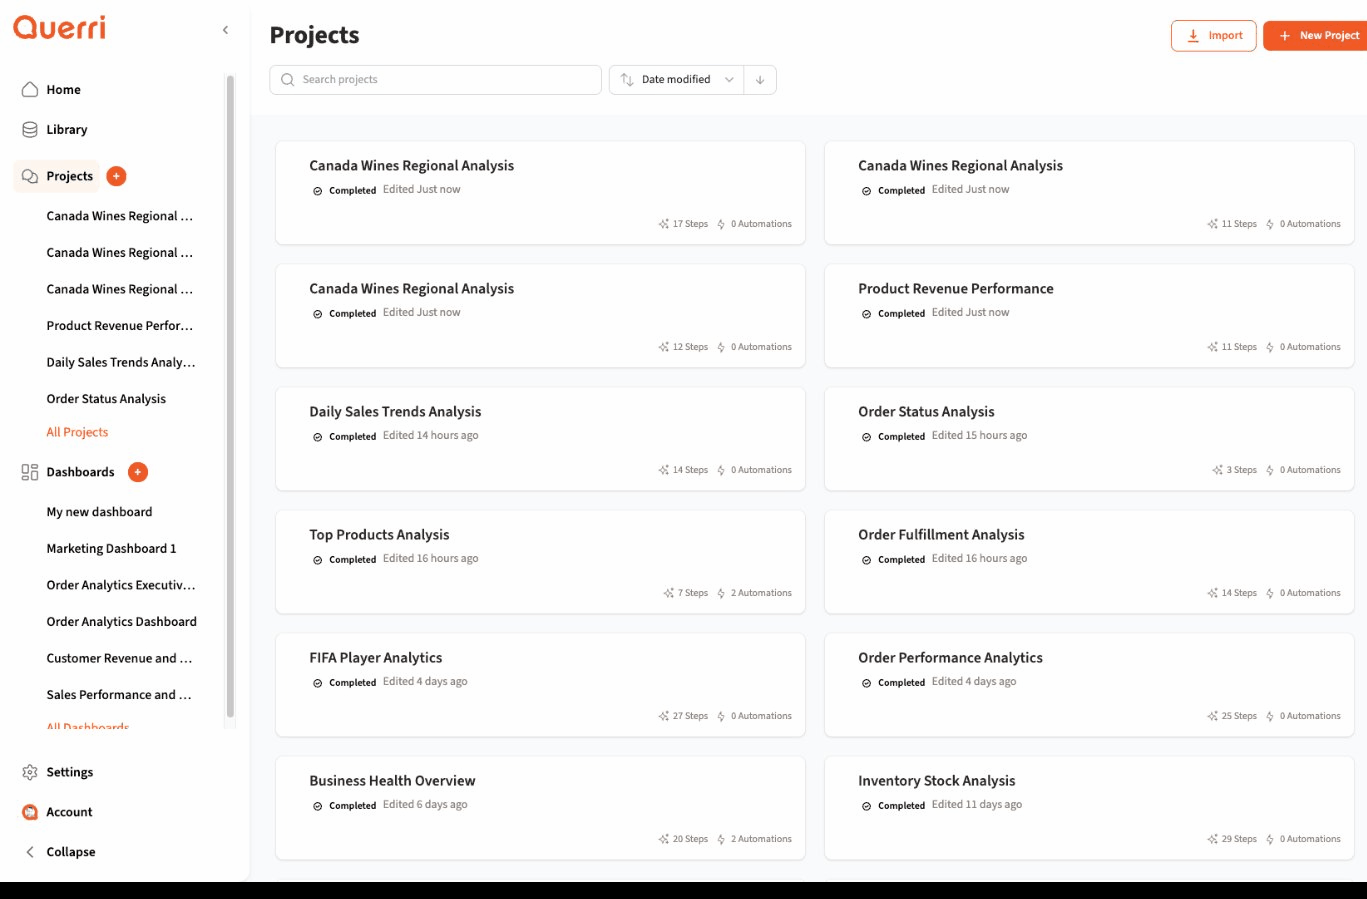
Section titled “Project List Enhancements”The Projects page now supports bulk operations and improved navigation.
Bulk Operations
- Select multiple projects with checkboxes
- Bulk delete with confirmation dialog
- Bulk share to team members
Navigation & Search
- Search projects by name with instant results
- Sort projects by date modified
- Virtualized list for smooth scrolling with hundreds of projects
Import & Export
- Import projects from
.qpfiles - Export projects for backup and sharing
- Preserve project structure and data
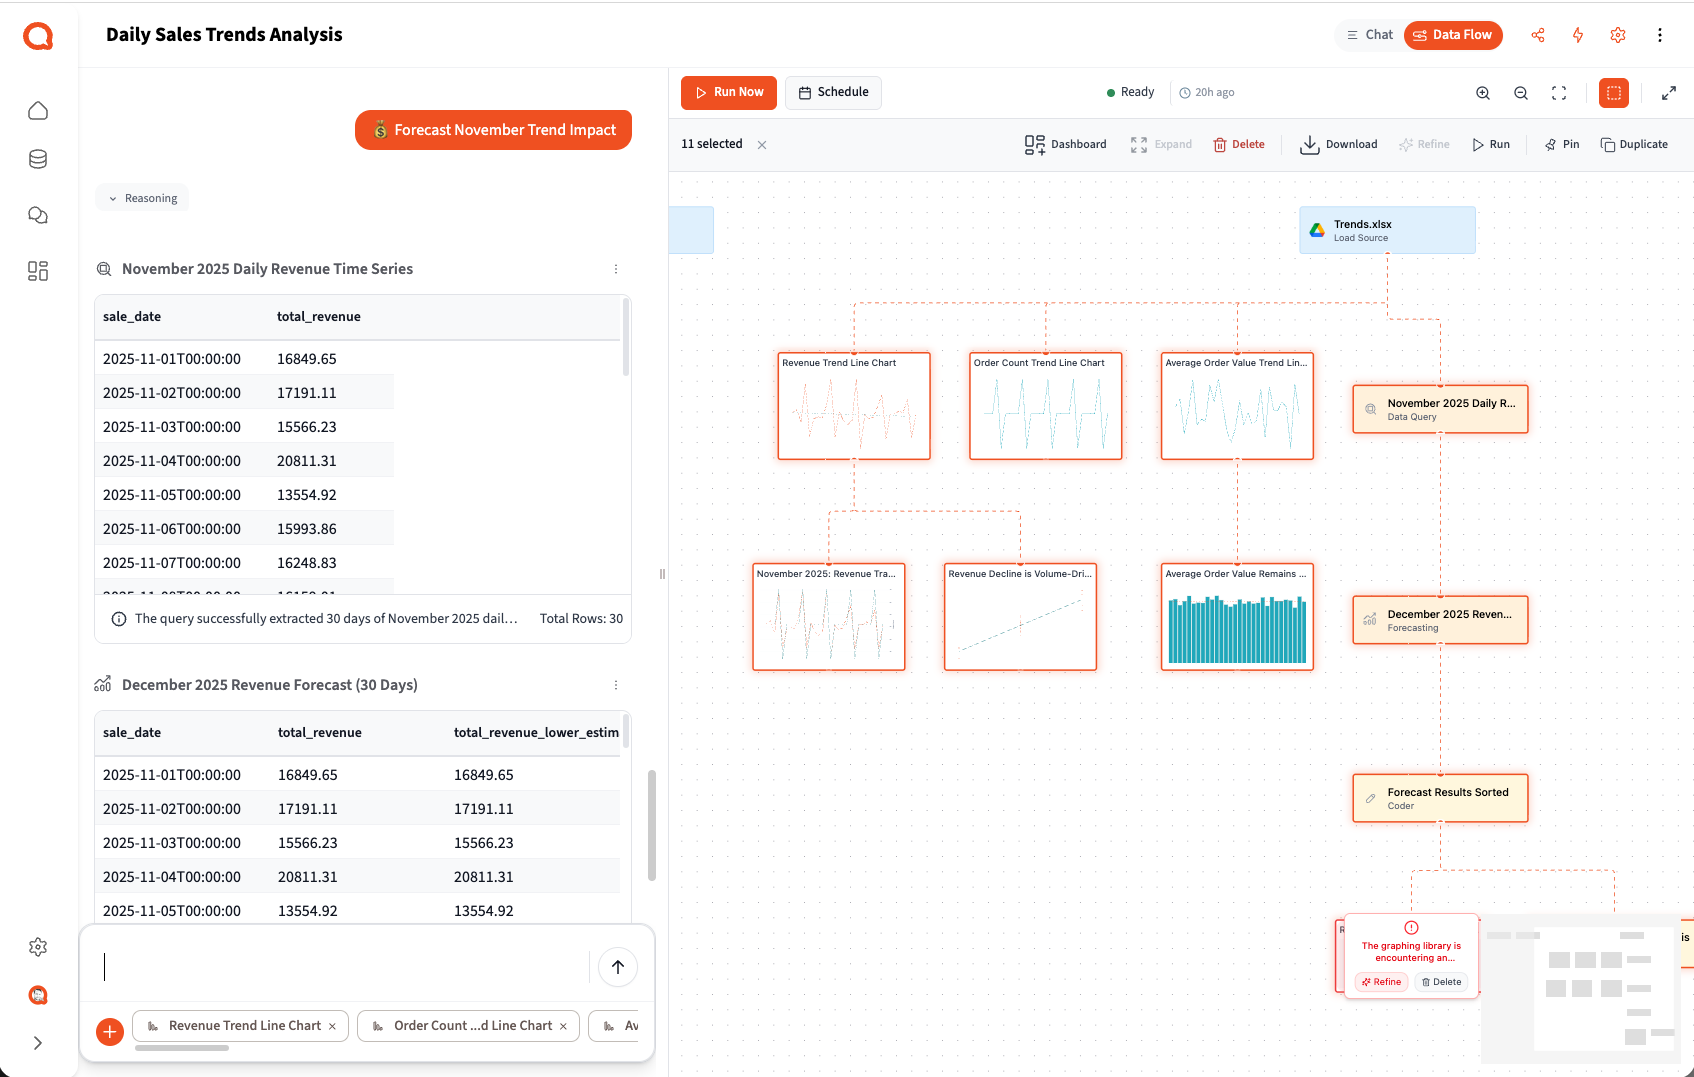
Data Flow Overhaul
Section titled “Data Flow Overhaul”The Data Flow panel has been completely redesigned with new controls, visibility improvements, and powerful bulk operations.
New Toggle & Access
- Dedicated header toggle to switch between Chat and Data Flow views
- Cleaner interface with focused controls
- New export indicator showing scheduled automation status
Run Controls
- Run Now button for immediate execution
- Run From Here in the context menu to execute from any step
- Schedule access directly from the Data Flow panel
- Visual status indicators (running, completed, failed, cancelled)
Context Menu Actions
- Right-click any step for quick actions
- Duplicate step or duplicate entire branch
- Delete step with confirmation
- Run from this step
- Add to dashboard
Bulk Operations
- Multi-select steps by holding Shift or Ctrl/Cmd
- Bulk download results from multiple steps
- Bulk add selected steps to dashboard
- Bulk delete with confirmation
Export & Automation
- Export to Google Drive on automation runs
- Improved scheduling interface
- Visual export indicators on automated steps
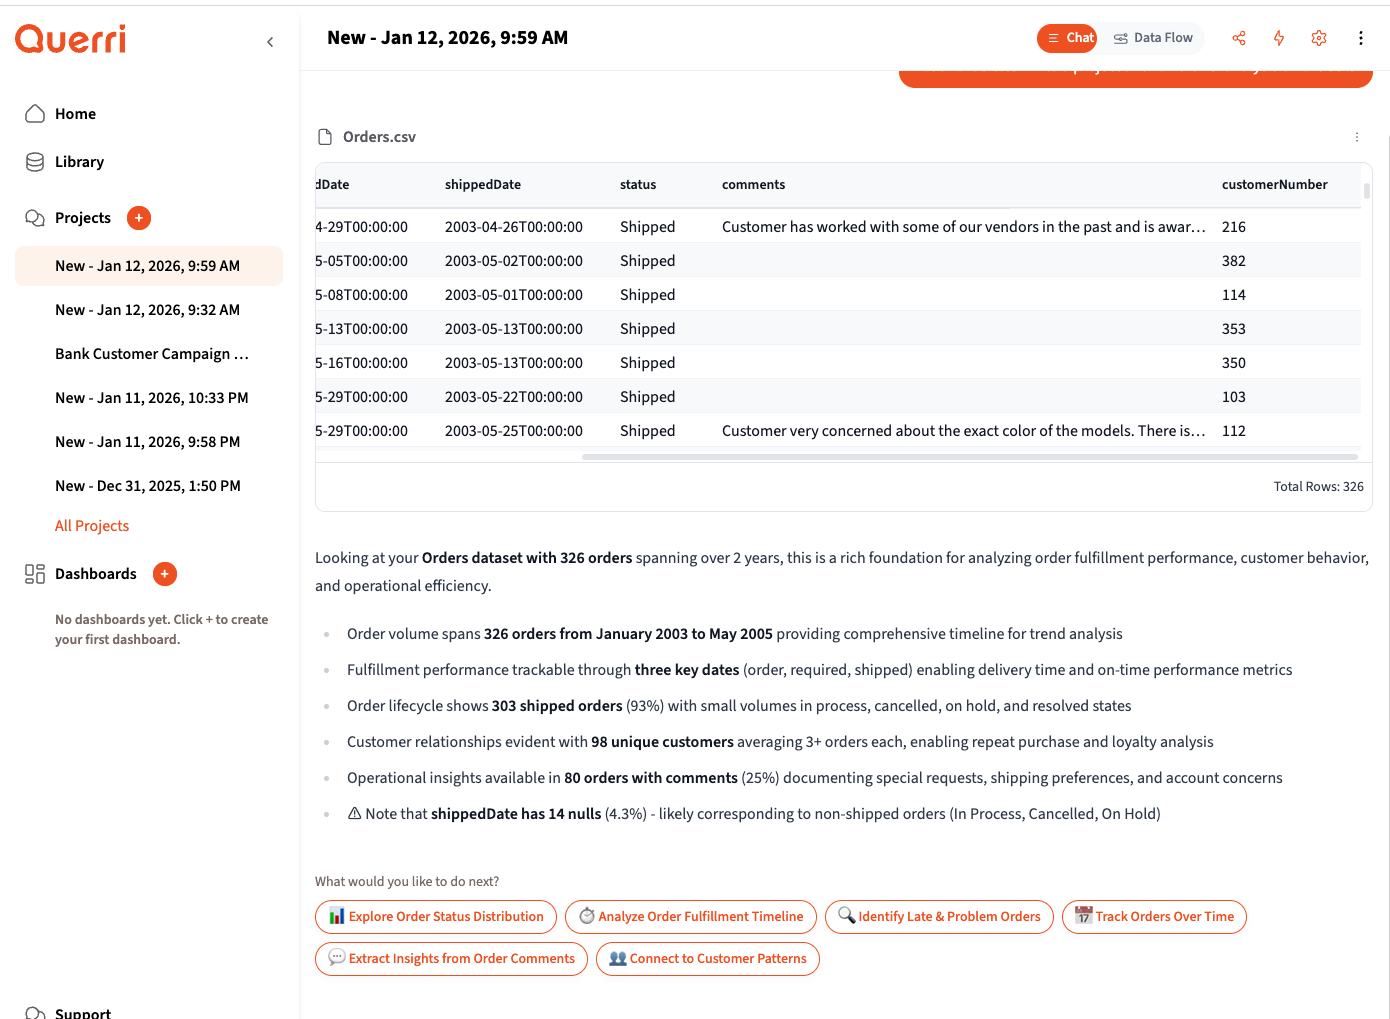
Researcher: Structured Data Extraction
Section titled “Researcher: Structured Data Extraction”Transform unstructured text into clean, structured data with Querri’s enhanced Researcher feature. This release introduces an iterative UI that makes it easy to extract insights from free-text fields like notes, comments, and memos.
Smart Recommendations
- Automatic detection of text fields that contain extractable insights
- Context-aware suggestions like “Extract Insights from Order Comments”
- One-click extraction to get started quickly
Intelligent Extraction
- Extracts multiple attributes in a single pass (theme, urgency, action required, sentiment)
- Maintains consistency across your entire dataset
- Supports custom extraction schemas or let the AI determine the best structure
- Handles messy, real-world data gracefully

Seamless Integration
- Extracted fields automatically join back to your source data
- Follow-on recommendations for analysis and visualization
- Export structured results to Excel or continue with further analysis
- Build on extracted insights with the full Querri toolkit
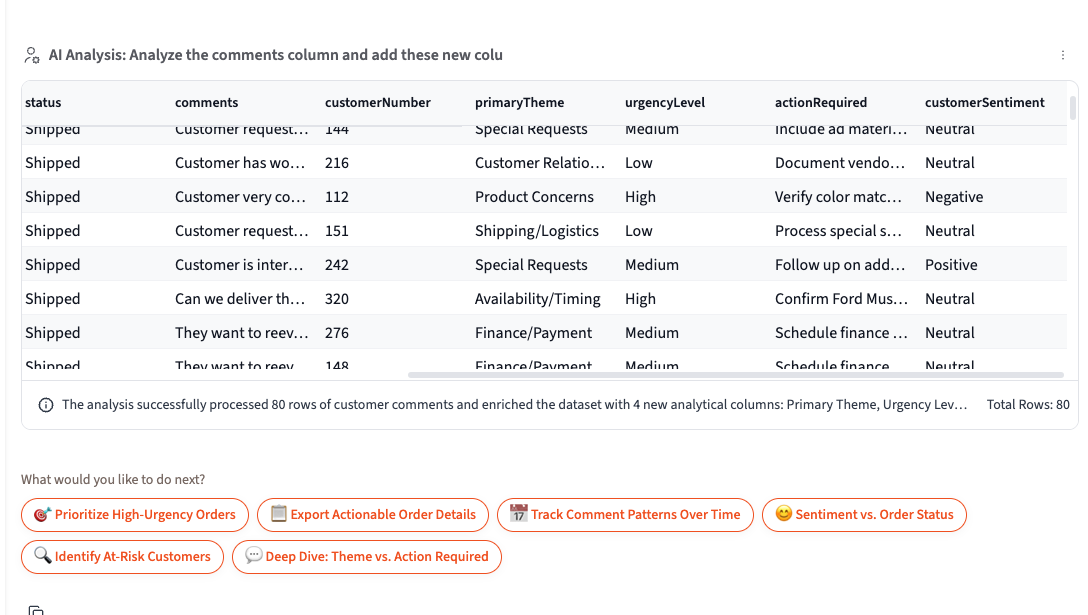
Expanded Panel with Step Refine
Section titled “Expanded Panel with Step Refine”The new expanded panel provides detailed views of your analysis results with inline refinement capabilities.
Panel Features
- Full-screen chart and table visualization
- Result Summary with AI-generated insights
- Detailed Explanation of the analysis
- Generated Code view showing the underlying logic
Quick Actions
- Add to Dashboard - Send results directly to any dashboard
- Export Settings - Configure export options
- Download - Download results in various formats
- Visit Details - Deep-dive into step configuration
Refine Prompt
- Tweak individual steps without affecting the rest of your flow
- Natural language refinement (“Make the chart show only last 30 days”)
- Preview changes before applying
- Iterate on specific steps without re-running entire analysis
Export to Google Drive & Querri Library
Section titled “Export to Google Drive & Querri Library”Querri project outputs can now flow directly into Google Workspace or back into Querri itself, enabling powerful automated workflows.
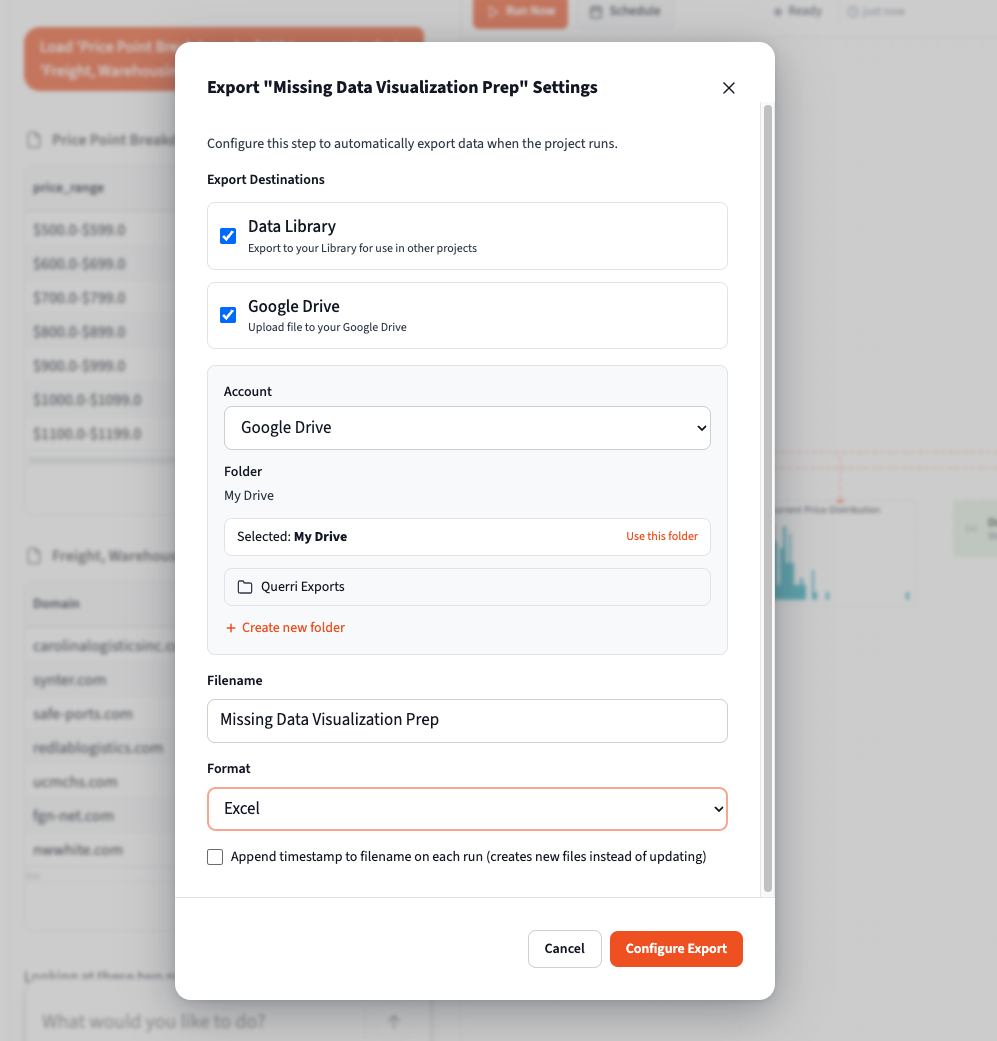
Google Drive Integration
Export your analysis results directly to Google Drive on scheduled automation runs. Your Querri outputs become Google Sheets that colleagues can access, comment on, and use in their own workflows—without needing Querri access. This makes Querri a natural part of your existing Google Workspace automation.
Querri Library
Save outputs to the Querri Library to use them as inputs for new projects. This creates a virtuous cycle: one project’s results become another project’s source data, enabling multi-stage analysis pipelines and reusable datasets across your organization.
Additional Export Options
- Download charts as PNG or SVG (SVG is editable in PowerPoint via “Convert to Shapes”)
- Multi-tab Excel exports with formatted tables and figures
- Direct download to your computer
Installable Desktop App
Section titled “Installable Desktop App”Querri can now be installed as a standalone desktop application using Progressive Web App (PWA) technology.
Installation Options
- Install from the Settings > Account page
- Use the install icon in your browser’s address bar
- Works on Windows, macOS, and Linux
Desktop Experience
- Runs in its own window without browser chrome
- Quick launch from your desktop or dock
- Better performance compared to browser-based access
- Automatic updates when new versions are released
- Basic offline functionality
File Type Registration
- Register data types like CSV and Parquet with Querri
- Open supported files directly in Querri from your file manager
- Faster access to your data files
Data Import Settings
Section titled “Data Import Settings”Configure how Querri handles your data imports with the new customization options at Settings > Customize.
Import Behavior
- Set default handling for empty values in CSV and Excel files
- Configure column type detection preferences
- Customize date format parsing rules
Usability Enhancements
Section titled “Usability Enhancements”Chat Experience
Section titled “Chat Experience”The chat interface has received significant performance and usability improvements.
- Expandable reasoning panel with auto-collapse for completed blocks
- Plain English responses with technical details in reasoning blocks
- Session restoration on page refresh - pick up where you left off
- Improved auto-scroll behavior during streaming
- Clear error overlays with one-click retry
- Visible status indicators for running, completed, and failed steps
Accessibility
Section titled “Accessibility”Input & Labels
- Improved input labeling throughout the application
- Better form field descriptions
- Enhanced screen reader support
Visual
- Better button color contrast
- Cleaned up accessibility issues across UI components
- Improved focus indicators
View-Only Mode
Section titled “View-Only Mode”- Clear view-only indicators for shared projects
- Enhanced chat view-only experience
- Proper permission handling for viewers
- Viewers cannot enter prompts or modify data
File Handling
Section titled “File Handling”Import Support
- Multi-tab Excel support with tab navigation
- Configurable empty value filtering for CSV/Excel imports
- Better .xls file compatibility
Upload Experience
- Improved drop upload status display
- Better file redirect handling
- Progress indicators for large files
AI & Analysis Enhancements
Section titled “AI & Analysis Enhancements”LiteLLM Migration
Section titled “LiteLLM Migration”The backend AI infrastructure has been migrated to LiteLLM for improved provider flexibility.
- Complete infrastructure port and rework
- Updated tool calling mechanisms
- Plain English responses for better readability
- Technical details moved to reasoning blocks
Examine & Refine
Section titled “Examine & Refine”The Examine and Refine tools have been completely overhauled for better data exploration.
Examine Improvements
- Memory-optimized data loading for large datasets
- Better handling of empty result sets
- Improved settings and configuration panels
- Multi-tab Excel support with table navigation
- Enhanced performance with virtualized tables
Refine Feature
- Reinstated refine functionality with new overlay UI
- Inline refinement from the expanded panel
- Natural language tweaks to individual steps
- Better display of analysis explanations
Performance & Stability
Section titled “Performance & Stability”This release includes a major upgrade to the frontend application along with extensive performance optimizations across the entire stack.
Frontend Performance
Section titled “Frontend Performance”| Area | Improvement |
|---|---|
| Chat | Faster rendering with memoization and throttling |
| Tables | Improved loading, caching, and state restoration |
| Project List | Virtualization for smooth scrolling with many projects |
| Navigation | Preloading for faster page transitions |
| Bundle Size | Dynamic imports reduce initial load time |
| Static Assets | Improved cache control and compression |
Backend Performance
Section titled “Backend Performance”| Area | Improvement |
|---|---|
| Job Processing | Faster polling and job pickup |
| Suggestions | Speed improvements for project suggestions |
| File Import | Better handling of large files with empty values |
| Data Caching | Smart caching for table and step data endpoints |
| Settings | Prefetching and caching for settings pages |
Caching Infrastructure
Section titled “Caching Infrastructure”Client-Side
- File caching for faster repeated access
- Chat suggestion caching
- Settings and account data caching
Server-Side
- ETag support for efficient data fetching
- Conditional requests to reduce bandwidth
- Improved permission caching
Bug Fixes
Section titled “Bug Fixes”Critical Fixes
Section titled “Critical Fixes”| Issue | Fix |
|---|---|
| Data Import | Fixed errors when importing files with empty values |
| Project Creation | Fixed timing issue when creating new projects |
| Chat Resume | Fixed session resume functionality |
| Image Rendering | Fixed multiple image display issues |
Data & Import Fixes
Section titled “Data & Import Fixes”| Issue | Fix |
|---|---|
| Legacy Excel Files | Fixed read errors for .xls format |
| CSV Attachments | Fixed display issues |
| Empty Tables | Improved handling of zero-row result sets |
| Bulk Share | Fixed sharing to multiple users |
UI Fixes
Section titled “UI Fixes”| Issue | Fix |
|---|---|
| Step Results | Fixed race conditions on load |
| Drag and Drop | Fixed issues on canvas components |
| Chart Height | Fixed responsiveness issues |
| Tooltips | Fixed initialization and update logic |
| Settings Icon | Fixed icon clipping in sidebar |
| Viewer Prompts | Fixed viewers being able to enter prompts |
| Charts | Fixed broken graphs after performance changes |
| Chart Annotations | Fixed datetime annotation positioning |
Chat & Streaming Fixes
Section titled “Chat & Streaming Fixes”| Issue | Fix |
|---|---|
| Reasoning Display | Fixed display issues during streaming |
| Duplicate Messages | Prevented duplicate messages in chat |
| Step Data | Fixed data not appearing in results panel |
| File Uploads | Fixed race conditions on redirect |
| Notifications | Fixed stale notification timeouts |
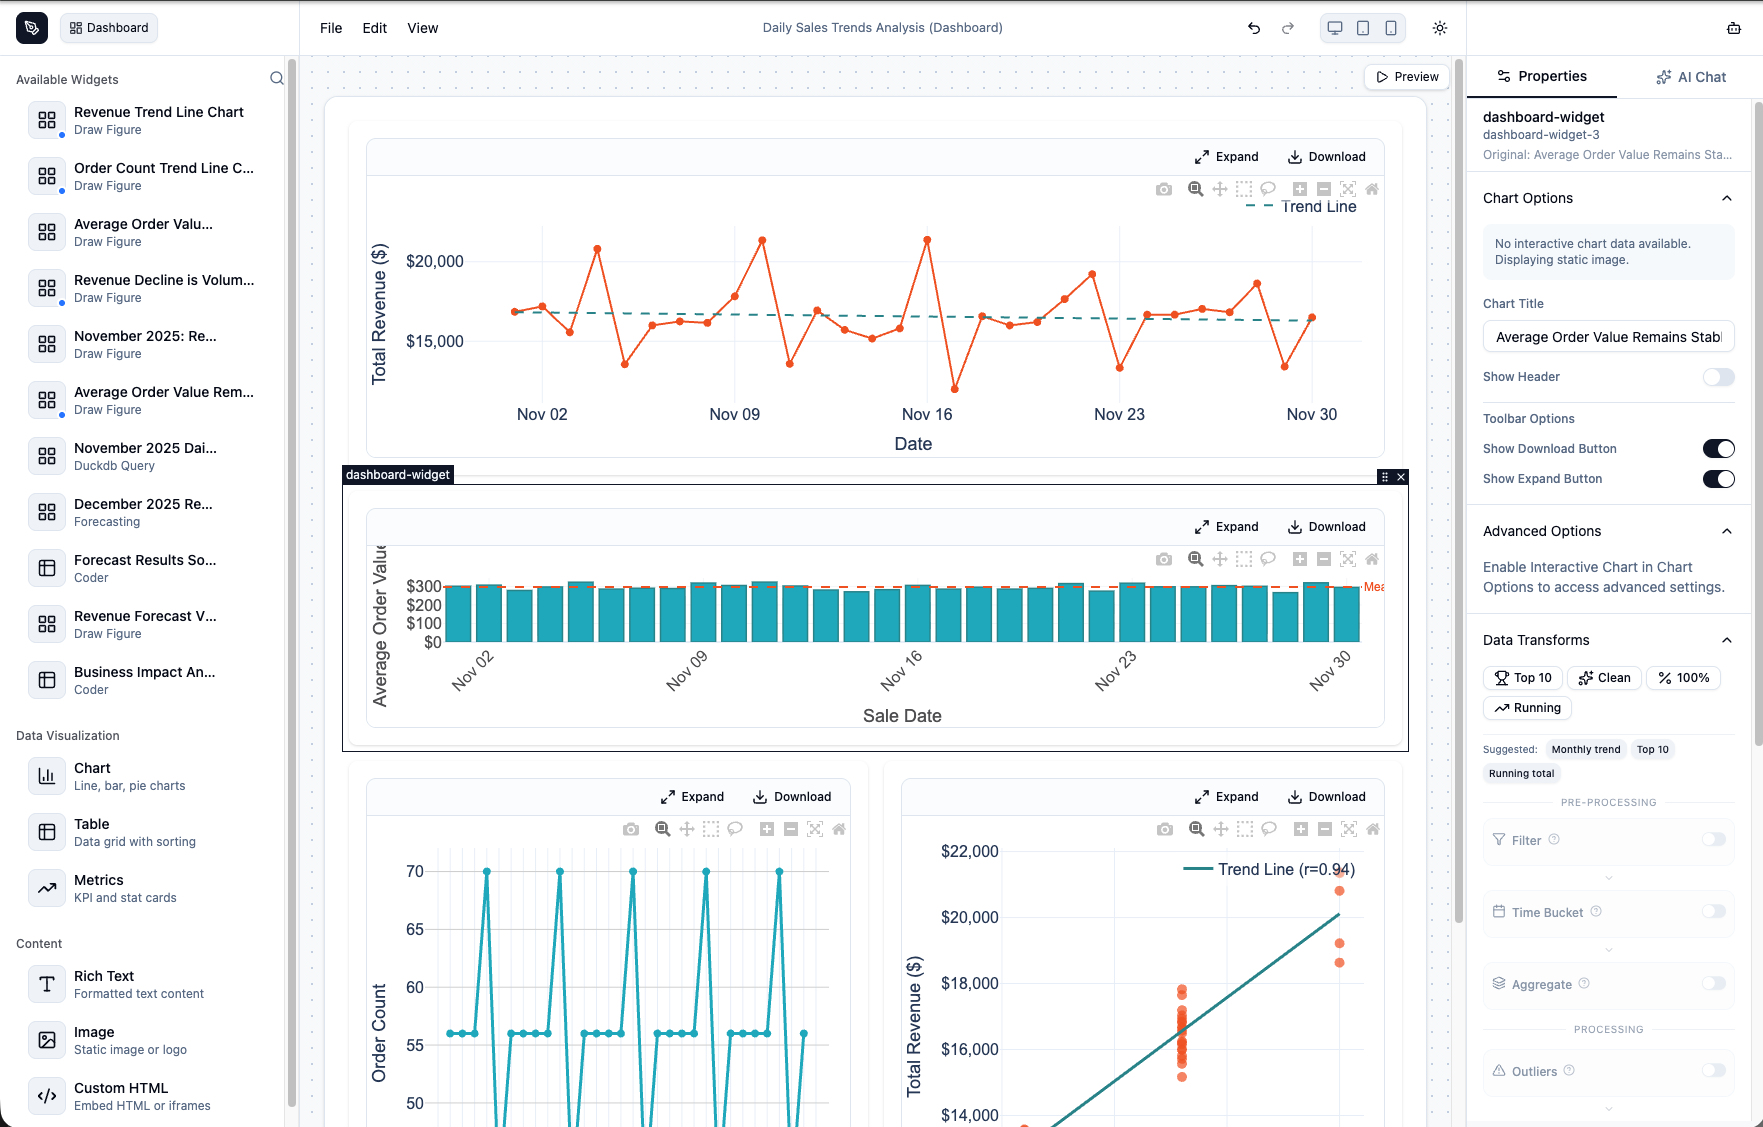
Dashboard Builder (Beta)
Section titled “Dashboard Builder (Beta)”The completely rebuilt Dashboard Builder provides a powerful drag-and-drop interface for creating interactive dashboards from your analysis results. This feature is currently in beta.
Widget Library
- Charts (Plotly-powered with full interactivity)
- Tables with pagination and virtualization
- Metrics and KPI cards
- Rich Text blocks
- Images
- Custom HTML widgets
Interactive Plotly Charts
- Annotations and watermarks
- Zoom controls and pan navigation
- Data transforms and filtering
- Toolbar with download and expand options
- Customizable axes and legends
AI-Powered Generation
- Use the AI Chat panel to generate dashboard layouts automatically
- Describe your dashboard in natural language
- AI validates and refines configurations
Additional Features
- Search and filter widgets in the sidebar
- Schema migration support for older dashboard formats
- Customizable canvas background, grid gap, and padding
- Card style toggle for widget containers
- Responsive preview modes (Desktop, Tablet, Mobile)
Access the Beta: Navigate to /builder/dashboard/{uuid} to edit any dashboard in the new builder.
Known Issues
Section titled “Known Issues”Dashboard Builder
- Currently in beta - access via URL modification (
/builder/dashboard/{uuid}) - Some older dashboard formats may require manual adjustment after migration
Data Flow
- Very large flows (50+ steps) may experience layout delays during streaming
Release Date: January 2026