Working with Data Sources
Querri helps you analyze data from various sources. This guide covers how to upload files, connect to data sources, and work with the Library to manage your data.
Uploading Files
Section titled “Uploading Files”The simplest way to get data into Querri is by uploading files.
Supported File Formats
Section titled “Supported File Formats”Querri supports common data formats:
- CSV (.csv) - Comma-separated values
- Excel (.xlsx, .xls) - Microsoft Excel spreadsheets
- JSON (.json) - JavaScript Object Notation
- Parquet (.parquet) - Efficient columnar storage format
How to Upload
Section titled “How to Upload”You can upload files in several ways:
From the Library
Section titled “From the Library”- Navigate to your Library
- Click Upload File
- Select your file from your computer
- Wait for the upload to complete
The file is now stored in your Library and can be used in any project.
During a Chat Session
Section titled “During a Chat Session”When you start a new project or ask to analyze data:
- The AI may prompt you to add a data source
- Click the upload option
- Select your file
- Continue your conversation
The uploaded data becomes available immediately for analysis.
Drag and Drop
Section titled “Drag and Drop”Querri supports drag-and-drop file uploads:
- Drag your file from your computer
- Drop it into the chat area or upload zone
- The file uploads automatically
File Size Considerations
Section titled “File Size Considerations”- Most files under 100MB upload quickly
- Larger files may take longer but are supported
- Very large datasets (1GB+) may require special handling
If you’re working with extremely large data, consider filtering or sampling before upload.
Referencing Data in Chat
Section titled “Referencing Data in Chat”Once data is uploaded, you reference it in your questions:
By File Name
Section titled “By File Name”“Analyze sales_data.csv” “Show me trends in customer_orders.xlsx”
Implicitly
Section titled “Implicitly”If you’ve already mentioned a dataset: “Filter to 2024” (AI knows which dataset you mean) “Now show me monthly totals” (continues with same data)
Multiple Sources
Section titled “Multiple Sources”“Join sales_data.csv with customer_info.xlsx on customer_id” “Compare revenue trends between region_north.csv and region_south.csv”
The AI understands context and can work with multiple data sources in a single analysis.
Using the Library
Section titled “Using the Library”The Library is your central data repository in Querri.
What’s in the Library?
Section titled “What’s in the Library?”The Library stores:
- Uploaded files: CSV, Excel, JSON, and other data files
- Connected sources: Links to databases and external systems
- Metadata: Information about each data source
Benefits of the Library
Section titled “Benefits of the Library”Reusability: Upload once, use in many projects Organization: Keep all your data in one place Efficiency: No need to re-upload the same file for different analyses
Accessing the Library
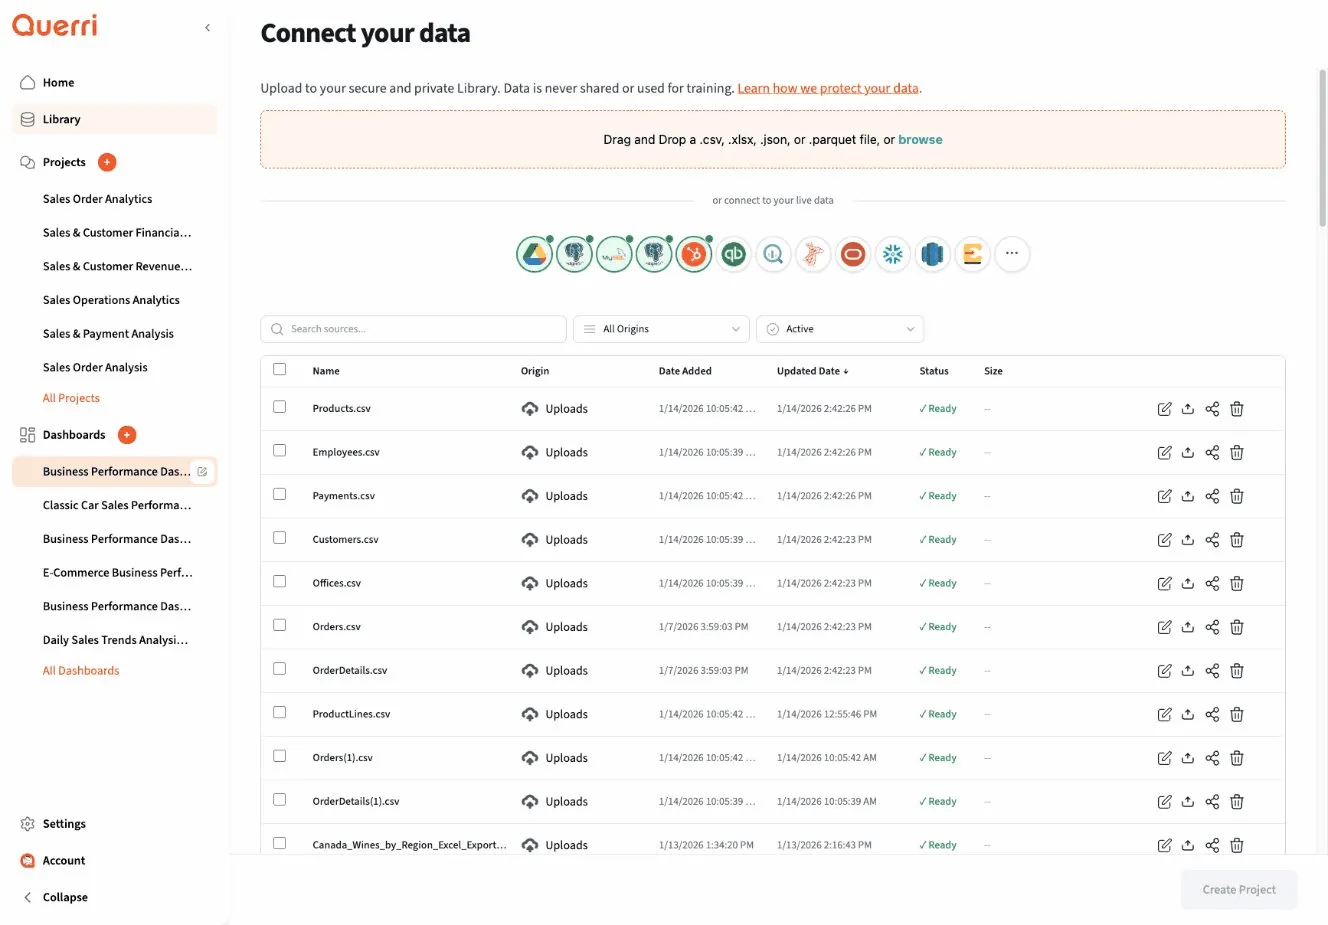
Section titled “Accessing the Library”Navigate to Library in the sidebar. The Library displays your data sources in a table showing:
- Name: The data source name
- Origin: Where it came from (Upload, PostgreSQL, Google Drive, etc.)
- Date Added: When it was added
- Updated Date: Last update time
- Status: Current state (Active, Syncing, etc.)
- Size: Data size
Use the search bar and dropdowns to filter sources by origin or status. Click the actions menu on any source to delete it.
Adding Data to Projects
Section titled “Adding Data to Projects”When starting a new project:
- Begin your chat
- The AI prompts for data or you mention what you want to analyze
- Select from Library or upload new
- Start analyzing
You can add more data sources as your analysis progresses.
Adding Sources During Conversation
Section titled “Adding Sources During Conversation”You don’t need to upload everything upfront:
You: “Analyze customer purchase patterns” AI: Loads customer data from Library
You: “Compare that with our marketing campaign data” AI: “I’ll need the marketing data. Would you like to upload it or select from the Library?”
You: Uploads marketing_campaigns.csv
AI: Continues analysis with both datasets
This flexible approach lets you build your analysis iteratively.
Working with Multiple Data Sources
Section titled “Working with Multiple Data Sources”Querri excels at combining data from multiple sources:
Joining Data
Section titled “Joining Data”“Join orders.csv with customers.csv on customer_id” “Merge product data with sales data”
Comparing Datasets
Section titled “Comparing Datasets”“Compare Q1 sales to Q2 sales” “Show differences between actual_revenue.csv and forecasted_revenue.csv”
Appending Data
Section titled “Appending Data”“Combine all regional sales files into one dataset” “Append this month’s data to the year-to-date file”
The AI handles the technical details of combining data sources.
Connected Data Sources
Section titled “Connected Data Sources”Beyond file uploads, Querri can connect to live data sources:
Database Connections
Section titled “Database Connections”- PostgreSQL
- MySQL
Cloud Storage
Section titled “Cloud Storage”- Google Drive
Business Applications
Section titled “Business Applications”- QuickBooks
- HubSpot
Setting Up Connections
Section titled “Setting Up Connections”To connect an external data source:
- Navigate to Library
- Click the connection type you want to add
- Follow the authentication flow
- Select which data to sync
- The connection appears in your Library
Once connected, reference the data source by name in your analysis just like an uploaded file.
Data Privacy and Security
Section titled “Data Privacy and Security”Where is Data Stored?
Section titled “Where is Data Stored?”- Uploaded files are stored securely within Querri
- Connected sources remain in their original location
- Querri queries data but doesn’t necessarily copy entire databases
Access Control
Section titled “Access Control”- Your Library data is private to you
- Share access when you share projects
- Remove access by unsharing or deleting data
Deleting Data
Section titled “Deleting Data”Remove data from the Library when you no longer need it:
- Navigate to Library
- Select the data source
- Click Delete or similar action
- Confirm deletion
Projects using deleted data may not function properly, so delete carefully.
Best Practices
Section titled “Best Practices”Organize Your Library
Section titled “Organize Your Library”- Use clear, descriptive file names: “sales_2024_q1.csv” not “data.csv”
- Delete old or unused data periodically
- Keep related datasets together (naming conventions help)
Prepare Clean Data
Section titled “Prepare Clean Data”While Querri can clean data, uploading clean data saves time:
- Remove extraneous rows (headers, footers, notes)
- Use consistent column names
- Ensure dates are in recognizable formats
- Avoid special characters in column names when possible
Start Small, Scale Up
Section titled “Start Small, Scale Up”When working with large datasets:
- Test with a sample first
- Verify your analysis approach
- Then run on the full dataset
This prevents wasting time if your approach needs adjustment.
Document Your Sources
Section titled “Document Your Sources”Consider keeping notes about where data came from:
- Original source
- Date obtained
- Any preprocessing done
- Refresh frequency for connected sources
This context helps when revisiting projects later.
Troubleshooting
Section titled “Troubleshooting”Upload Failed
Section titled “Upload Failed”If an upload fails:
- Check file format is supported
- Verify file isn’t corrupted
- Try a smaller sample of the data
- Check internet connection
Can’t Find Data in Library
Section titled “Can’t Find Data in Library”- Use the search function
- Check if it was deleted
- Verify you’re logged in to the correct account
Data Looks Wrong
Section titled “Data Looks Wrong”If data appears incorrect after upload:
- Check the original file
- Verify encoding (UTF-8 is standard)
- Look for parsing issues (wrong delimiter, etc.)
- Try re-uploading
Example Workflow
Section titled “Example Workflow”Here’s a typical workflow for working with data sources:
- Upload file to Library: sales_2024.csv
- Start new project: “Analyze sales trends”
- AI loads data: From Library
- You continue analysis: “Break down by region”
- Add more data: Upload regions.csv for regional details
- Combine sources: “Join sales with region data”
- Complete analysis: Create visualizations and insights
- Clean up: Remove temporary files from Library if needed
Next Steps
Section titled “Next Steps”- Learn best practices for prompting to work effectively with your data
- Understand how to interpret results
- Explore visualization options for your data