Dashboard Basics
Dashboard Basics
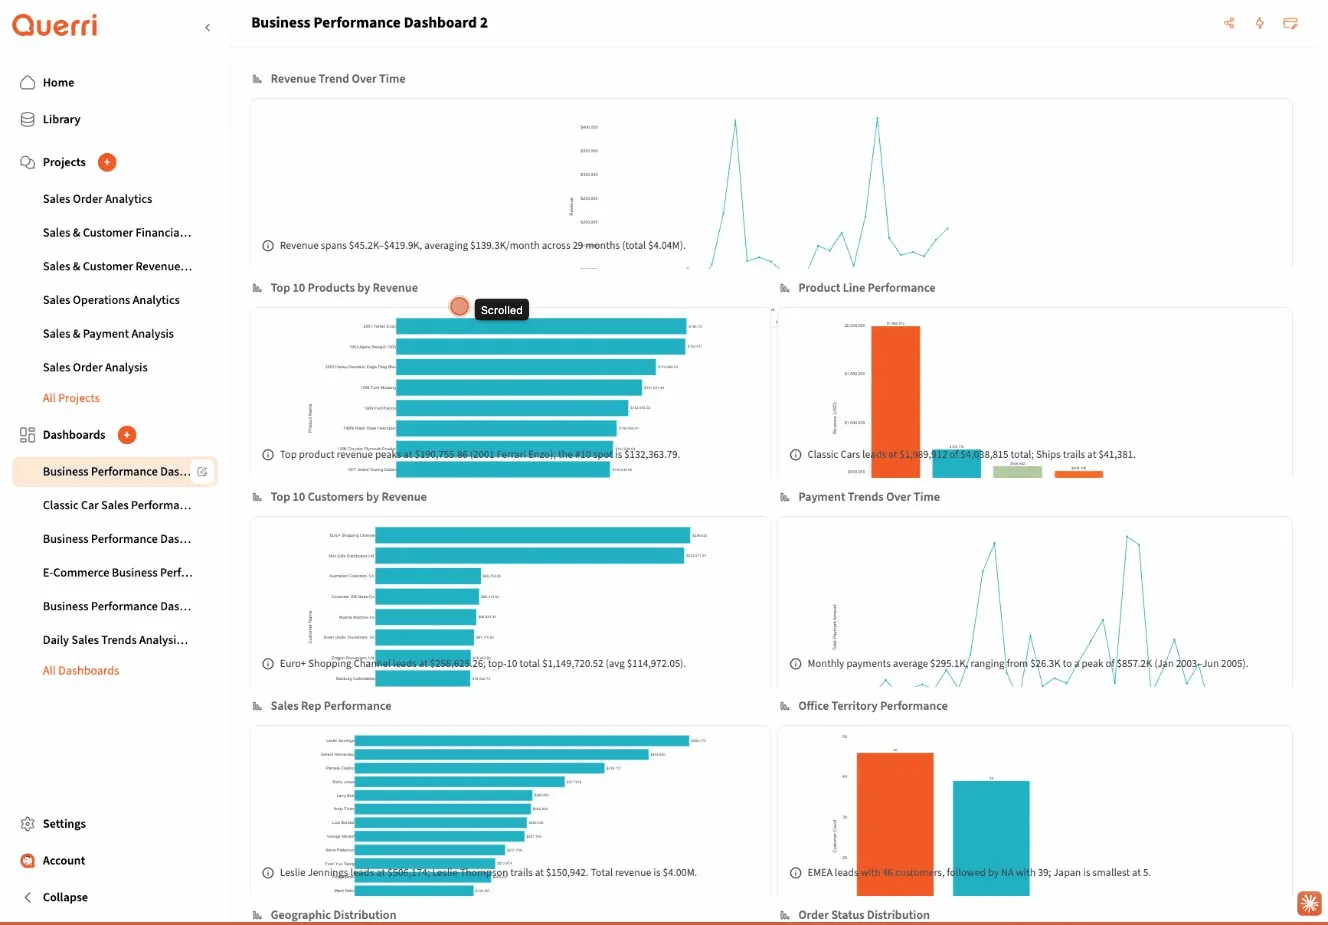
Section titled “Dashboard Basics”Dashboards in Querri provide a powerful way to visualize and monitor your data in real-time. This guide will help you understand what dashboards are and how to create your first one.
What are Dashboards?
Section titled “What are Dashboards?”Dashboards are a Pro feature in Querri that allow you to create interactive, visual displays of your data. Unlike projects, which are designed for data exploration and analysis, dashboards are optimized for:
- Monitoring key metrics at a glance
- Sharing insights with team members and stakeholders
- Tracking performance over time
- Presenting data in a polished, professional format
You can access dashboards by navigating to the /dashboard route in your Querri workspace.
Creating Your First Dashboard
Section titled “Creating Your First Dashboard”Getting started with dashboards is straightforward:
- Navigate to Dashboards: Click on the “Dashboards” link in the main navigation or visit
/dashboard - Create New Dashboard: Click the “New Dashboard” button
- Name Your Dashboard: Dashboards are automatically created with timestamped names (e.g., “Dashboard_2024-01-15_143022”), but you can rename them to something more descriptive
- Add Widgets: Start adding widgets to display your data
Quick Start Example
Section titled “Quick Start Example”Let’s create a simple sales dashboard:
- Create a new dashboard and name it “Sales Overview”
- Add a metric widget to show total revenue
- Add a chart widget to display revenue trends over time
- Add a table widget to list top-performing products
- Arrange the widgets in a layout that makes sense for your use case
Dashboard vs. Projects
Section titled “Dashboard vs. Projects”Understanding when to use dashboards versus projects is important:
| Feature | Projects | Dashboards |
|---|---|---|
| Purpose | Data exploration and analysis | Data monitoring and presentation |
| Interactivity | Full data manipulation and transformation | View and filter pre-configured data |
| Audience | Analysts and data workers | Stakeholders and decision-makers |
| Updates | Manual execution of steps | Scheduled refreshes and automation |
| Sharing | Collaboration on analysis | Public or team sharing with controls |
When to Use Dashboards
Section titled “When to Use Dashboards”Dashboards are ideal for:
- Executive reporting: Present high-level KPIs to leadership
- Team monitoring: Track team performance metrics
- Client reporting: Share progress with external stakeholders
- Operational dashboards: Monitor real-time business operations
- Scheduled reporting: Automate regular data updates and distribution
Dashboards are not the best choice for:
- Initial data exploration (use projects instead)
- Complex data transformations (do this in projects first)
- Ad-hoc analysis (projects are more flexible)
Dashboard Layout and Widgets
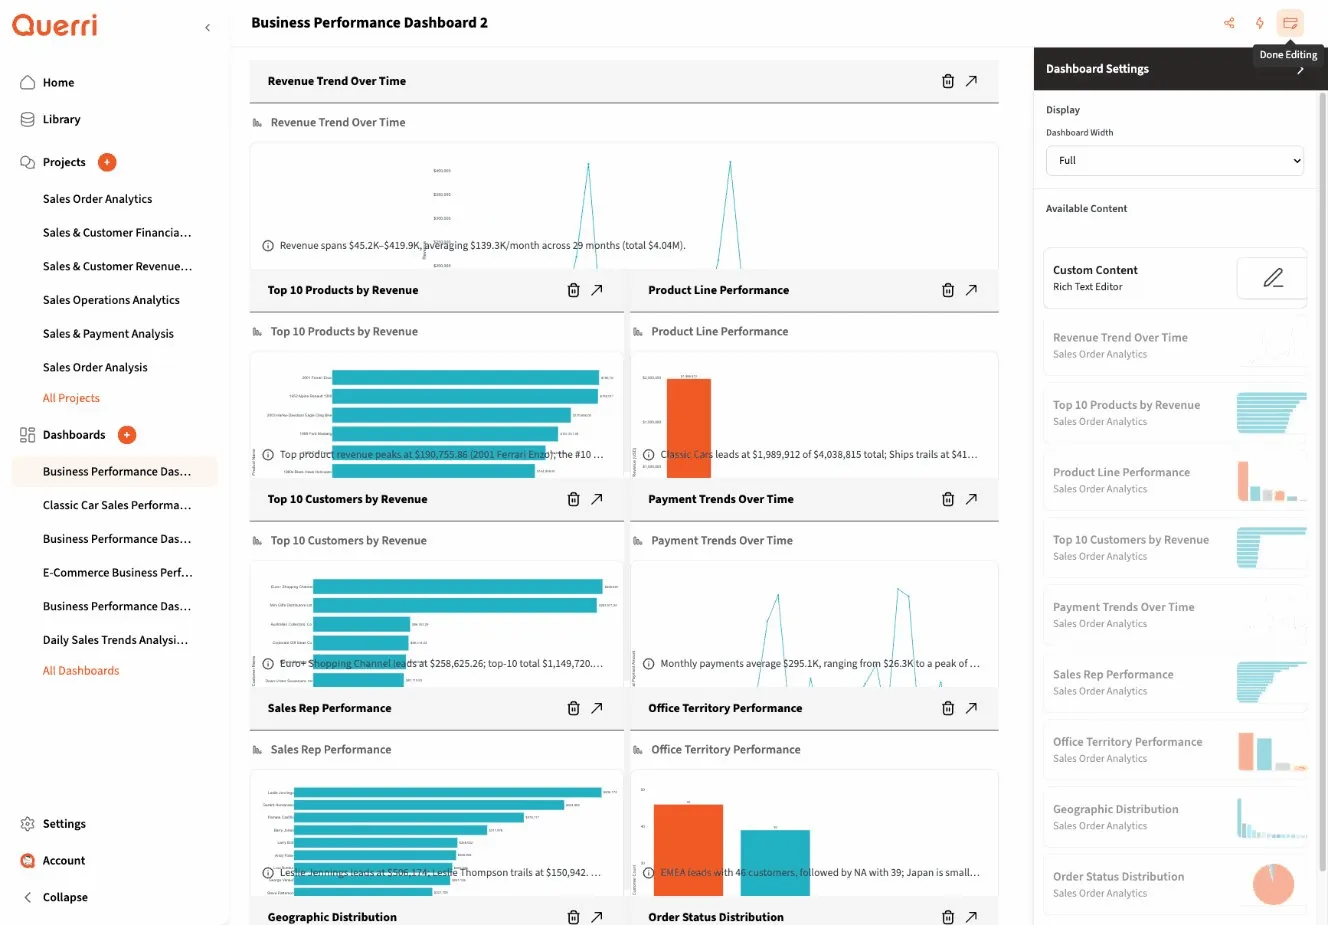
Section titled “Dashboard Layout and Widgets”Dashboards use a flexible grid layout system that allows you to:
- Arrange widgets by dragging and dropping
- Resize widgets to emphasize important information
- Create sections to organize related metrics
- Optimize for different screen sizes with responsive design
Layout Best Practices
Section titled “Layout Best Practices”- Put the most important information at the top: Users naturally scan from top to bottom
- Group related metrics together: Create visual sections for different aspects of your data
- Use white space effectively: Don’t overcrowd your dashboard
- Consider your audience: Executive dashboards should be simpler than operational ones
- Test on different devices: Ensure your dashboard looks good on desktop and mobile
Next Steps
Section titled “Next Steps”Now that you understand the basics, explore these topics:
- Widget Types - Learn about the different widgets available
- Dashboard Configuration - Customize your dashboard’s appearance and behavior
- Sharing Dashboards - Share your insights with others
Ready to create powerful, data-driven dashboards that drive insights and action!