
July 2026
This release makes Querri easier to put in front of your own users and to run on a schedule. Take finer control over how an embedded Querri looks and behaves, repeat an analysis across every row of your data with the new in-chat loops, and send reports by email from your own address. Under the hood, chart captions and summaries are better grounded in your actual data, interrupted responses recover on their own, and dashboard filtering is faster.
What’s New
Section titled “What’s New”Finer Control in the Embed Configurator
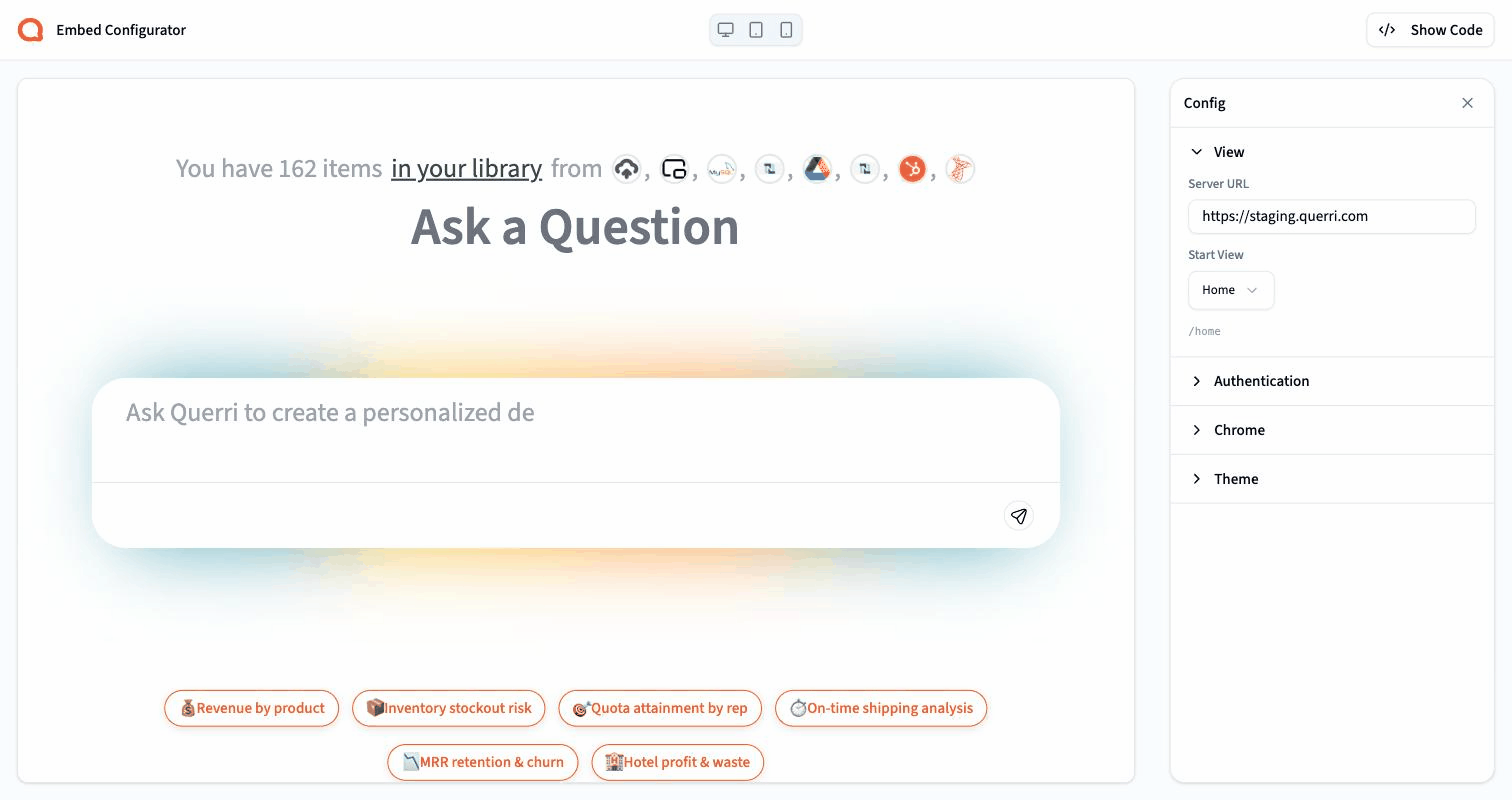
Section titled “Finer Control in the Embed Configurator”The Embed Configurator, where you build a branded, embeddable Querri visually and copy the code to drop into your site, gains a wave of new controls this release. You can now shape the sidebar, the welcome screen, and the chat in much finer detail, with every change reflected instantly in the live preview beside it.
Customize the welcome screen
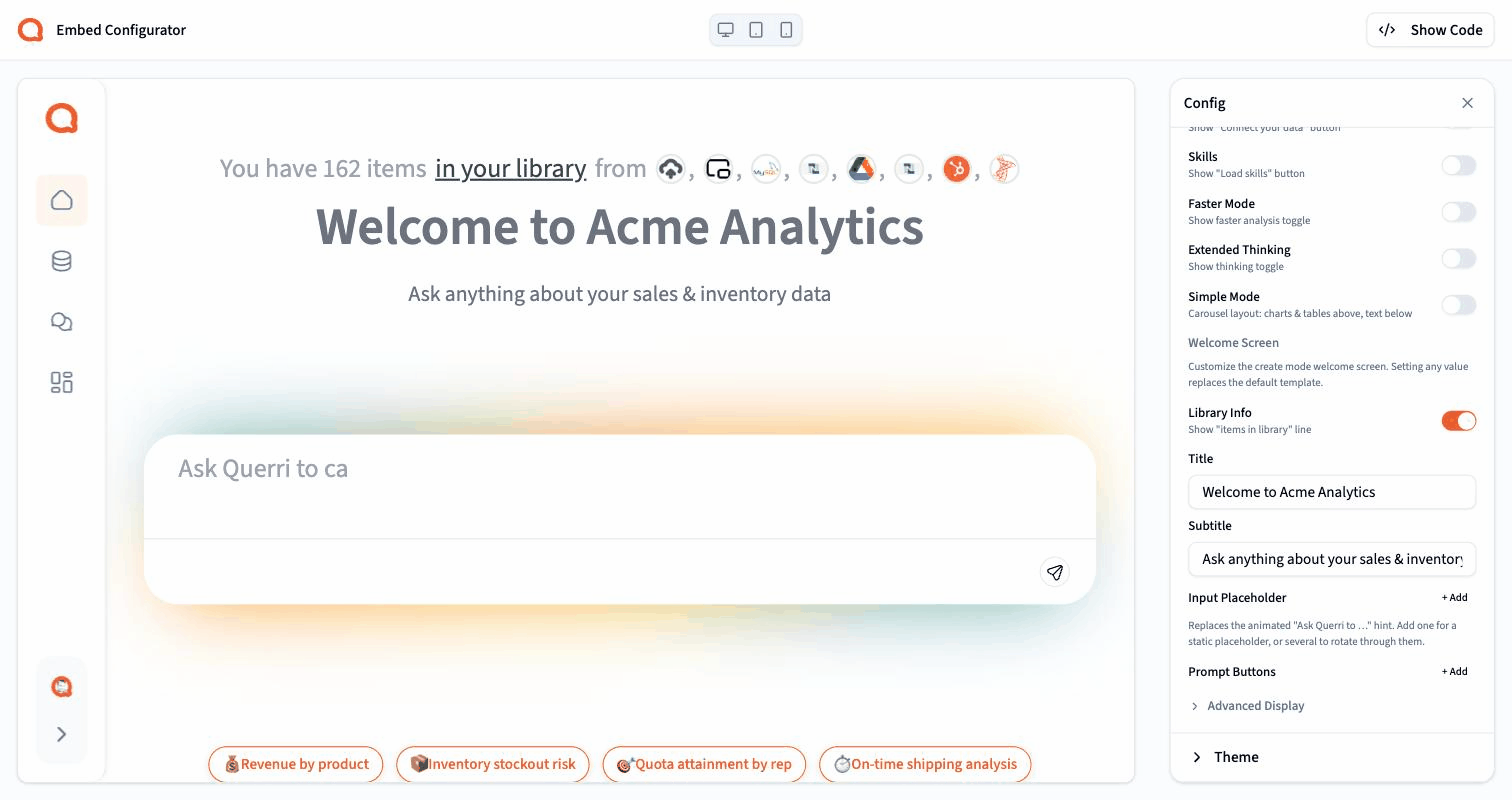
Make the first screen your own. Set a custom title and subtitle, replace the animated “Ask Querri to…” hint with your own placeholder (or a list of placeholders that rotate), add your own starter prompt buttons, and show or hide the “items in your library” line.
Control the sidebar down to each item
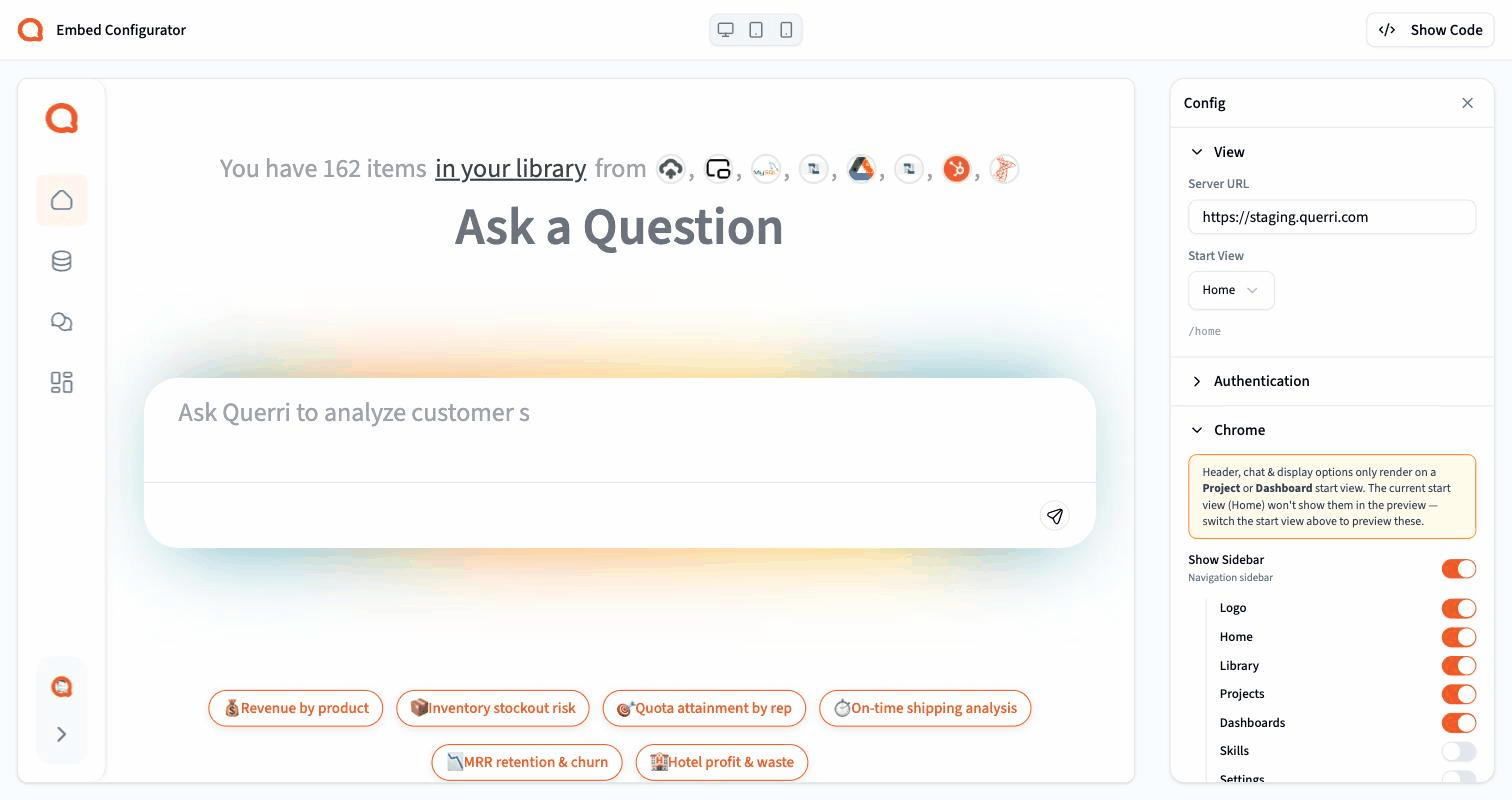
Show or hide the navigation sidebar, and within it toggle each item on its own: logo, Home, Library, Projects, Dashboards, Skills, Settings, Subscribe, Support, and Account. You can also hide the expand control and lock the sidebar open or collapsed, so an embed shows exactly the navigation you want and nothing else.
Fine-tune the chat and header
Turn individual chat controls on or off, including Faster Mode, Extended Thinking, Simple Mode, Full Width, and the Connect Data and Skills buttons, plus the top header and its actions. The welcome-screen and chat settings now apply on the Home start view too, not just inside a project, and the generated embed code is formatted for easy reading.
Run an Analysis Across Every Row with Loops
Section titled “Run an Analysis Across Every Row with Loops”Querri can repeat the same piece of work automatically for every row in a dataset, so a report that used to mean running one analysis per customer (or per region, per product, and so on) becomes a single step. Each loop now appears right inside the chat as a small live diagram, so you can watch it work and inspect any individual run.
- Build a loop by asking Querri to do something “for each” group in your data, then see it laid out in chat as a mini Data Flow, showing the analysis, chart, export, and delivery steps it will run for every row.
- Scrub through individual runs to view the exact table, chart, or email produced for any one row, rather than a single flat summary.
- When you first build a loop, Querri previews a small sample of rows instead of grinding through all of them, so you can confirm it looks right before committing to the full run.
- While a loop runs you see live “Processing row X of N” progress, so you can tell it is moving and spot any slow rows instead of watching a frozen bar.
Send Reports by Email From Your Own Address
Section titled “Send Reports by Email From Your Own Address”Querri can now send the emails and files your analyses produce through your own organization’s email account, so delivered reports come from your address and your mail server instead of a generic default. Delivery is also more honest about outcomes: a message that fails to send is reported as failed rather than quietly marked as sent.
- An administrator can set up per-organization delivery settings under Settings → Message Delivery: your own sending address, sender name, and mail server (SMTP) details, configured once and applied to every delivery.
- Your mail server password is stored encrypted and never shown back in full on screen.
- Admins can send a test email to confirm the settings work before relying on them for a real delivery.
- If a send fails, Querri tells you it failed and why, and does not charge a credit for the failed send.
A Refreshed Data Flow
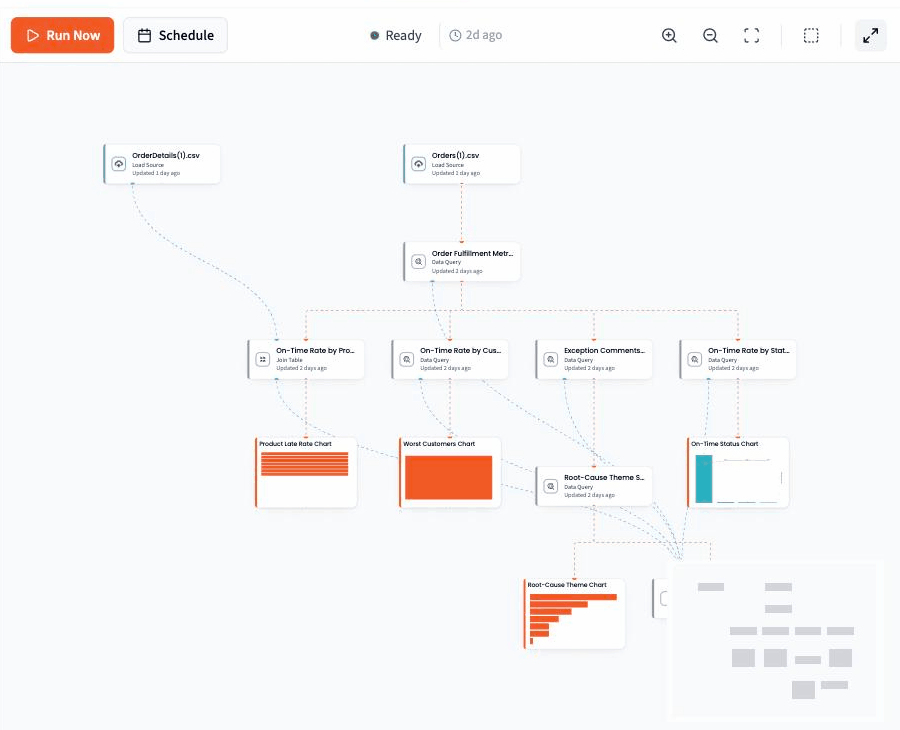
Section titled “A Refreshed Data Flow”The Data Flow canvas, where you see how your sources, steps, and outputs connect, got a visual refresh and clearer controls over what happens when you re-run a project.
A cleaner, more branded canvas
Data Flow nodes now use the Querri palette: clean white cards with a color-coded accent for each kind of step, so data sources, behind-the-scenes transforms, charts and insights, and exports and delivery are easy to tell apart at a glance.
Join and lookup sources show as connected
A source that a step only uses as a join or lookup dependency now stays visibly connected to that step with a permanent connector, instead of looking like a disconnected island. The connection is always drawn, so you no longer have to hover to see it.
Choose exactly what “Run Now” does
A new Run Now options dialog lets you pick what happens on a re-run: refresh source data from your library, regenerate export files, and send the configured emails and messages. Emails only go out when you explicitly choose to deliver them. Source steps also show a New data, Run from here pill when Querri detects the underlying data has actually changed since it was last used, so you know when a refresh is worthwhile and can re-run from that point in one click.
Tighter Grounding for Captions and Summaries
Section titled “Tighter Grounding for Captions and Summaries”Querri already writes its chart captions and summaries from your data. This release tightens that grounding and adds an extra verification pass, so the specific numbers and categories they mention line up even more closely with what is in your dataset.
- Specific numbers in a caption now get an added check against the underlying data before you see them, and are corrected or flagged when they do not line up.
- Captions and summaries now draw the names, categories, and values they mention from the full result rather than a smaller sample or a compressed chart image.
- Querri now accounts for blank or missing values in a column, so a list is not described as complete when it is not.
- When a summary cannot be fully verified, Querri holds back from stating shaky figures as fact.
Performance
Section titled “Performance”| Area | Improvement |
|---|---|
| Dashboard filtering | Building on the earlier dashboard-filter speedups, filtering is quicker again, especially on larger dashboards and data stored in the cloud. Charts redraw with the filtered data faster and with less waiting after you move a filter. |
Reliability
Section titled “Reliability”| Area | Improvement |
|---|---|
| Interrupted responses recover after a reload | If you reload the page while Querri is still answering, it reconnects, finishes the response, and re-enables the message box on its own. No more getting stuck on “Resuming previous response…” or needing a second reload to recover. |
| Steadier streaming | A run of fixes keeps long, streaming answers healthy end to end, so a dropped connection, a slow network, or a reload no longer leaves a response half-finished or a project stuck mid-run. |
| Very wide datasets | Opening a dataset with an unusually large number of columns now shows a clear message explaining there are too many columns to display, instead of failing silently. |
| Long profiling on big data | When Querri’s background profiling queries time out on a very large dataset, it now continues with the data it has and notes that some queries didn’t finish, instead of stalling on a spinner. |
| Connecting and re-uploading data | Slow database loads show honest elapsed time instead of a misleading “about 0 seconds remaining” countdown, large loads no longer stall the progress display partway through, and uploading a new version of a file replaces its contents in place while keeping the same identity so every project and dashboard that references it stays connected. Database connectors set to sync every table also pick up tables added after the connector was first set up. |
Bug Fixes
Section titled “Bug Fixes”| Issue | Fix |
|---|---|
| Stray line by the send button | Removed a stray vertical divider that showed next to the message box’s send button on the home screen. |
| Text-search filter on numbers and dates | Applying a text-search dashboard filter to a number or date column is now rejected with a clear message, since a text match would never find anything on those columns. |
| Repeated errors on a brand-new chat | Opening a chat that has not been saved yet no longer triggers repeated background errors and failed status checks. |
| Some chats crashed on load | Resolved a spreadsheet-component conflict that could crash certain chats with an unexpected error, so they open reliably. |
| Dashboards failing on a brief slowdown | A dashboard no longer shows a hard error page when a background service is briefly slow; temporary slowdowns are handled gracefully. |
| Projects built on a saved View | Fixed how saved Views load so projects built on them open correctly instead of failing with “could not load project.” |
| Large and complex requests | Querri handles large, complex prompts and long sessions more reliably, keeping them within safe limits so they complete instead of erroring. |
Release Date: July 2026