
Usage alerts
Usage Alerts warns you when your organization gets close to a plan limit, goes past one, or starts using credits much faster than usual. Querri raises these warnings on its own, so there are no thresholds to set.
Who can see this: everyone in the organization sees the alerts. Only admins see the settings below them.
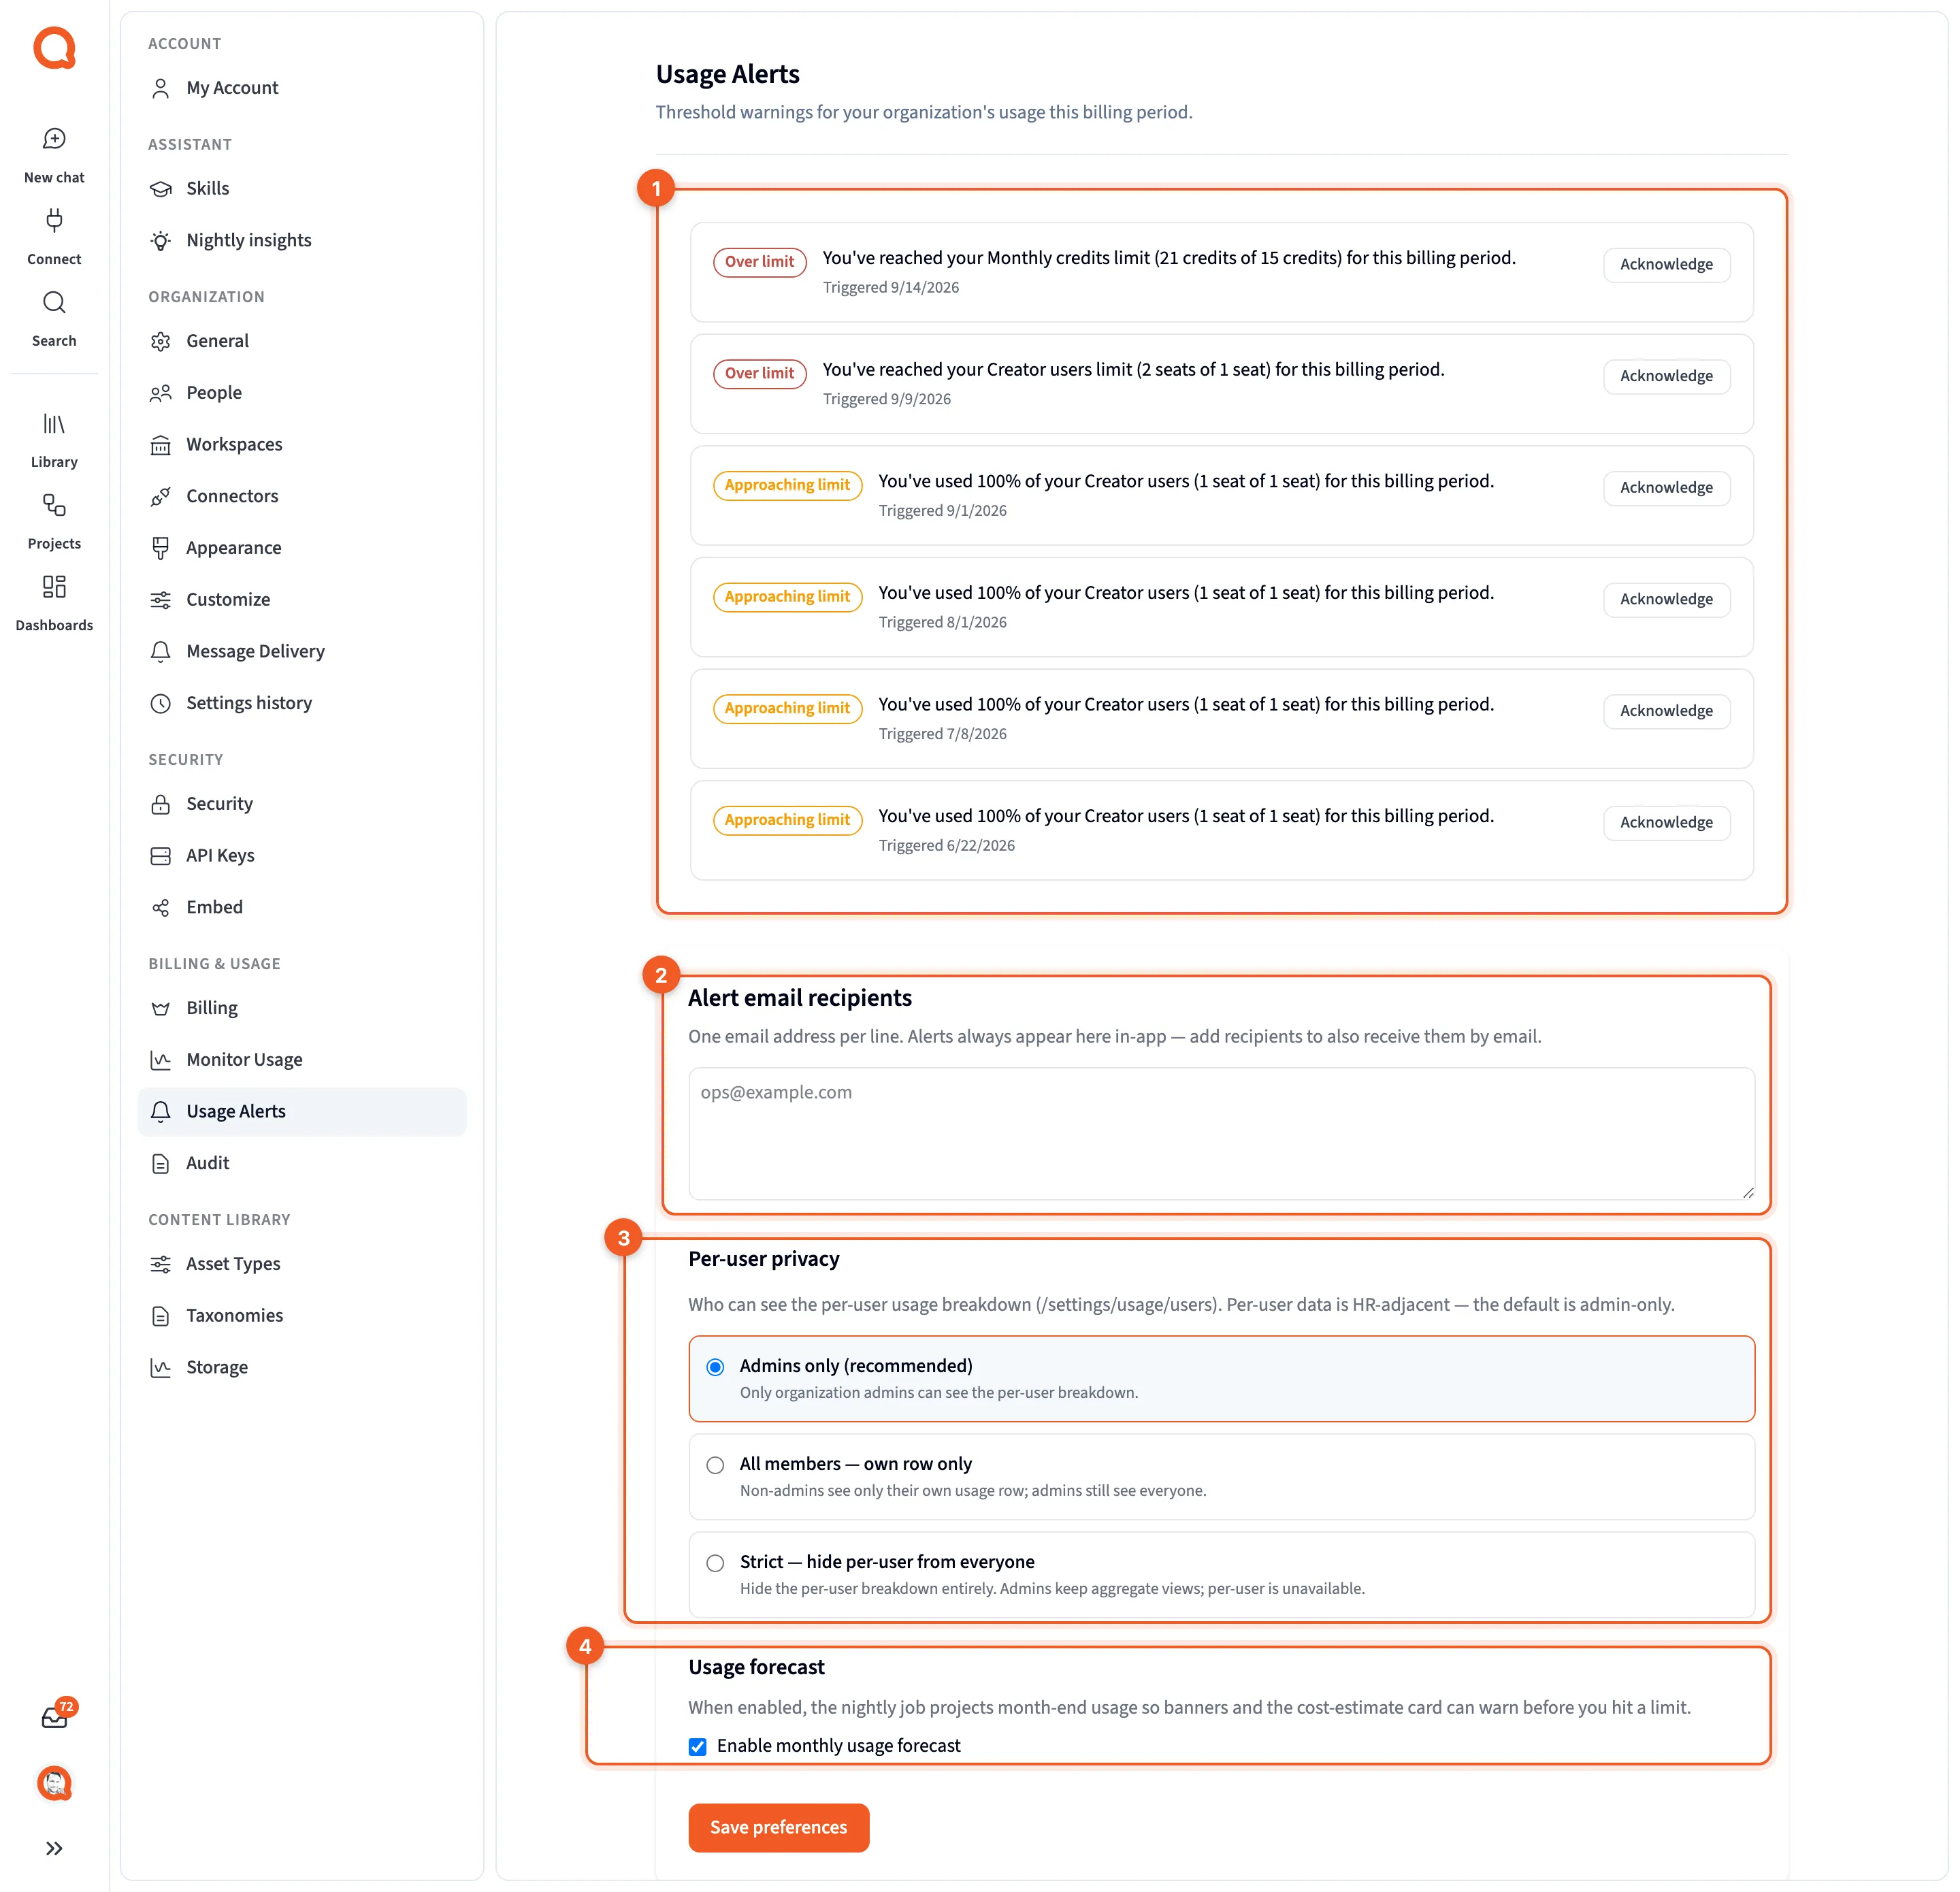
- The alert list: this billing period’s warnings.
- Alert email recipients: who else gets the alerts by email.
- Per-user privacy: who can see each person’s usage.
- Usage forecast: whether Querri projects month-end usage.
You’ll find it in Settings, under Billing & Usage › Usage Alerts.
The alerts
Section titled “The alerts”Each alert is one row with a badge, a message, and “Triggered {date}”. A typical message reads “You’ve used {pct}% of your {feature} ({used} of {limit}) for this billing period.”

- The badge: Approaching limit, Over limit or Usage spike.
Click Acknowledge once you’ve seen an alert. The row dims and the button changes to Acknowledged.
With nothing to report, the page reads “No usage alerts. You’ll be warned here when your organization approaches a limit.”
When an alert fires
Section titled “When an alert fires”Each night, Querri compares your organization’s usage with its plan limits. Features without a limit are skipped.
| Badge | When it appears |
|---|---|
| Approaching limit | A plan feature reaches 80% of its limit |
| Over limit | A plan feature goes past its limit |
| Usage spike | Credits are being used at three times the usual rate or more |
These alerts are about the whole organization. When one person reaches their own monthly credit limit, no alert appears here. Instead, nothing more runs for them until their credits reset, and they see “You have used all {limit} of your monthly credits. Your admin can raise your limit, and your credits reset on {date}.” Admins set those limits on People, under Organization in Settings. See People.
Alert settings
Section titled “Alert settings”Admins see three settings under the list. They share one Save preferences button, so nothing changes until you click it and see “Preferences saved.”
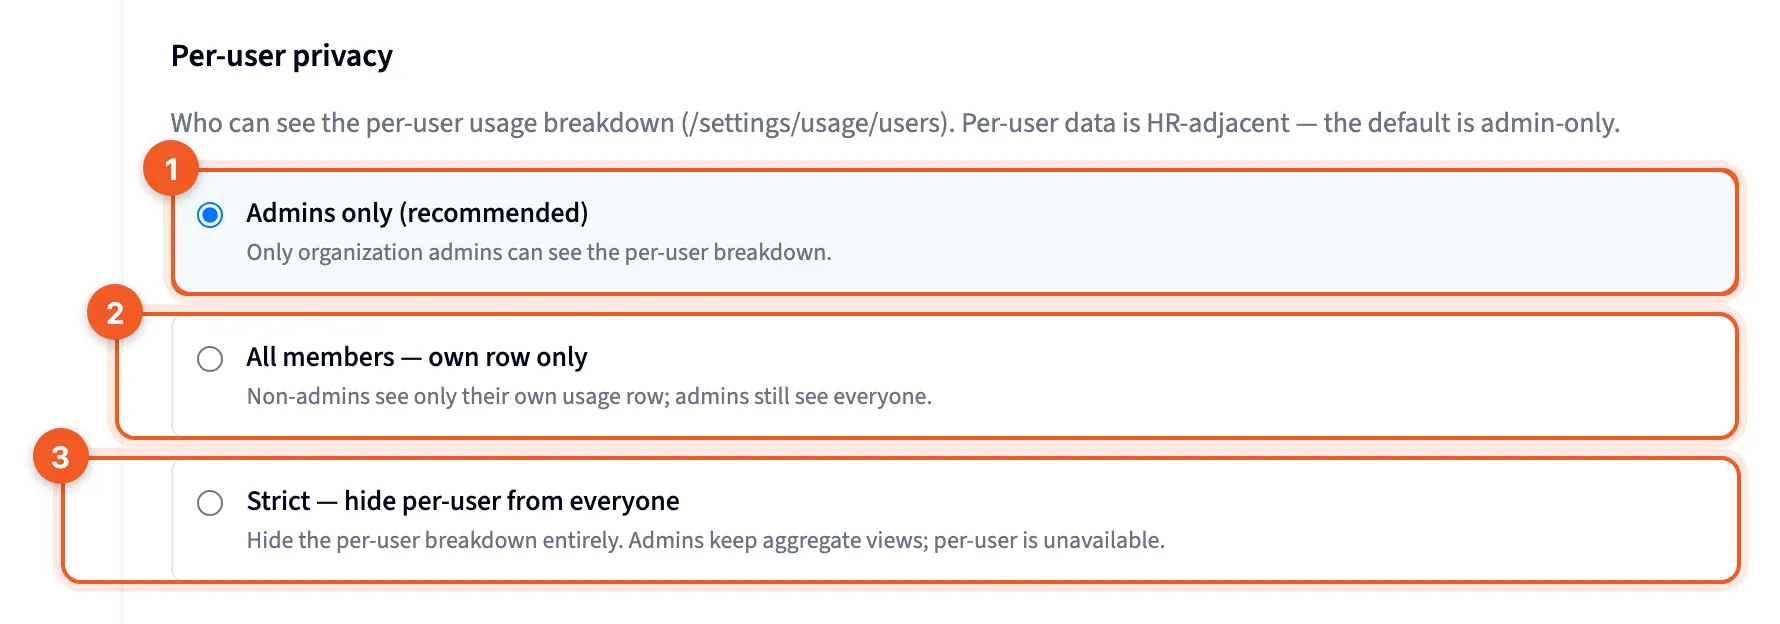
- Admins only (recommended): the default. Only admins see each person’s usage.
- All members: each member can see their own row, and nobody else’s.
- Strict: nobody sees per-person usage.
- Alert email recipients: one email address per line. Alerts always show on this page, and anyone you list here gets them by email as well.
- Per-user privacy: who can see the By user tab on Monitor usage, using the three choices above. Strict also hides other people’s names from admins in What used credits.
- Usage forecast: tick Enable monthly usage forecast. “When enabled, the nightly job projects month-end usage so banners and the cost-estimate card can warn before you hit a limit.”
Outbound webhooks
Section titled “Outbound webhooks”Admins also get an Outbound webhooks card. It sends events from Querri to an endpoint you run: usage thresholds, plan and subscription changes, billing failures, and pipeline failures. Every payload is signed with HMAC, using a secret that belongs to your organization.
Enter a Webhook URL (it must start with https://), tick the Events to send or Subscribe to all events, and click Save webhook settings. Nothing changes until you save. The first save generates the signing secret, and saving a new URL rotates it. Either way Querri shows the secret one time, so copy it into your endpoint’s settings straight away. Send test ping sends a test event once the URL and secret are saved. The card also shows how healthy the endpoint is.
If the card says Webhooks are paused, Querri support has paused deliveries for your organization. Your settings are kept, and support can switch delivery back on.
Events
Section titled “Events”| Event | When it’s sent |
|---|---|
org.created | A new organization was provisioned |
org.plan_changed | The organization switched to a different plan |
subscription.created | A new paid subscription started |
subscription.updated | The subscription’s tier or billing cycle changed |
subscription.canceled | The subscription was canceled (it ends at the end of the period) |
subscription.trial_ended | A trial is about to end, 3 days before it does |
entitlement.limit.warning | Usage reached 80% of a plan limit |
entitlement.limit.reached | Usage reached 100% of a plan limit |
entitlement.spike | Today’s usage is 3 times the daily average of the last 7 days |
billing.payment_failed | An invoice failed to charge |
billing.payment_recovered | A failed invoice was charged on a retry |
pipeline.failure | A view failed to rebuild, a scheduled project run stopped on a failed step or was repaired by AI, a connector schedule was turned off after repeated failures, or a sync removed or retyped a source’s columns |
What a delivery looks like
Section titled “What a delivery looks like”Each delivery is a POST with a JSON body:
| Field | What it holds |
|---|---|
event | The event name, such as pipeline.failure |
message_id | A unique ID for this event. Use it to ignore a delivery you’ve already handled |
ts | When it was sent, in Unix seconds |
org_id | Your organization |
environment_id | The Querri environment it came from |
data | The event’s details |
The headers include X-Querri-Event (the event name), X-Querri-Message-Id, and Stigg-Signature, in the form t={timestamp},v1={signature}. To check a delivery came from Querri, compute an HMAC-SHA256 with your signing secret over the timestamp, a full stop, and the raw body ({timestamp}.{body}), and compare its lowercase hex with v1.
Querri tries each delivery three times right away, a few seconds apart, while your endpoint times out, returns a 5xx error, or answers 408 or 429. If none of those get through, it tries up to three more times over the following days, for up to 7 days in all. An answer of 401, 403, 410, or any other 4xx except 408 and 429, isn’t retried right away and waits for those later tries. If your organization’s Per-user privacy is Strict, user IDs are removed from data.
The pipeline.failure event
Section titled “The pipeline.failure event”pipeline.failure carries the same notice the Inbox and email get, described in When data goes wrong. Its data holds:
| Field | What it holds |
|---|---|
subkind | What happened: view_rebuild_failed, project_run_stopped, repair_applied, schedule_disabled or schema_changed |
resource | What it’s about: kind (view, project, schedule or source), id and name |
error | What went wrong, in plain words |
error_type | A short code for the kind of error |
last_succeeded_at | When it last succeeded, or null |
stale | What’s still showing old data (or, for a schema change, what reads the source), as lists of names by kind, such as kpi, view, table, step, monitor, project and dashboard |
message | The whole notice as one sentence, ready to post to a chat channel |
open_url | A link to open it in Querri |
streak_id | The same for every event about one ongoing failure |
reminder | true on the one reminder sent when it’s still failing a day later |
failure_count | How many times it has failed in a row so far |
A schema_changed event also carries schema_diff (the columns added, removed and retyped, and possible_renames), affected (the views, KPIs, monitors, projects and dashboards that read the source, each with an ID and name), and mentions (removed columns a view’s SQL mentions by name).