
KPIs and the five dimensions of business value
Esta página aún no está disponible en español. Se muestra la versión en inglés.
Ask two people for average deal size and you can get two numbers. Both did the math right. One divided by every deal in the pipeline, the other only by deals that closed. Once that happens, people stop trusting either number. A KPI settles it: the number is defined once, the calculation is written down, and everyone who asks gets the same answer.
Leer la transcripción
Why two numbers don’t match
Querri keeps each of your KPIs defined once… so everyone calculates it the same way. Pull average deal size from two different reports, and you can get two different numbers. Ask a general AI chat tool the same question twice… and it can work it out two different ways.
What a KPI is
In Querri, a KPI is an actual calculation, written down once: measured from one table, with a value for each period. So whoever asks, it’s worked out the same way. Open one, and you can see exactly how it’s calculated, which table it comes from, and its latest value. When that table rebuilds, Querri recalculates it on its own. And those definitions don’t stay in the Library. When you ask something in a project, Querri pulls in the KPIs that match your question, and uses their calculations.
What your KPIs track
Under Metrics in your Library, each KPI tracks something different. Total sales revenue shows what’s coming in. Net retention rate shows whether revenue from existing customers is growing… and churn rate shows how many customers you’re losing. And each one sits in at least one of five categories of business value: revenue, cost, efficiency, quality, and risk… so you can see if you’re only tracking revenue, and missing the rest.
Add a new KPI
Adding a new KPI is easy: just ask the Librarian to track it… and once it’s measured from your data, it gets a value. If the data isn’t there yet, it starts out aspirational. Start with the KPIs that matter most to your business… define them once, and keep everyone working toward the same goals.
The idea
Section titled “The idea”In the Library’s own words, KPIs are “the numbers your business tracks, defined once so everyone calculates them the same way.”
A KPI has a few parts, and each one closes off a way two people could disagree. There’s a plain-language definition, with a Measurement section for the window, the aggregation and any filter. There’s the one table it’s Measured from, and the period it’s measured by, such as month. And there’s the Measurement SQL, the query that turns that table into one value per period. When the table rebuilds, the value is calculated again. And because the definition lives in one place, it’s used from one place: when the Librarian answers with a KPI, it quotes the KPI’s stored value instead of working the number out again.
Every KPI has a state: draft, active, aspirational or deprecated. Aspirational is the one you’ll see early on. It means you want to track the number even though nothing measures it yet. Onboarding sets up to three KPIs this way, and they show no value until they’re measured from a table.
You won’t find a button to create a KPI. They come from onboarding, from the Librarian as you chat, from accepting a Metric to track card in the Inbox, and from the API.
Want to change how one is calculated? Ask the Librarian. It’s worth reading the definitions it proposes, too, because a definition the Librarian picked may not match how your business counts. Somebody who knows the business should check it and correct it in chat if it’s off.
The five dimensions of business value
Section titled “The five dimensions of business value”Every KPI counts toward at least one of five dimensions: Revenue, Cost, Efficiency, Quality and Risk. The Librarian picks one to three when it adds a KPI, and you can switch any of them on or off. A KPI has to keep at least one, and there are always exactly five to choose from.
The point is balance. If every KPI you track lights up Revenue, you’re watching the money come in and nothing else.
An example
Section titled “An example”In the Curio Library these docs use for examples, the Average Deal Size KPI answers the question from the top of this page. Its definition reads: “Average deal size per month, calculated as total won amount divided by the number of distinct won opportunities, grouped by the month the deal closed.” Won deals only, each counted once, by the month it closed.
It’s measured from the view Pipeline by stage, by month. Its state is active and its one dimension is Revenue. Anyone who wants the exact query can open Measurement SQL.
Net Retention Rate, in the same Library, is at a different stage. It’s aspirational, and its panel says Not yet computable, with a suggestion to ask the Librarian to measure it from the view that holds the data. It already counts toward Revenue and Efficiency.
A KPI with a Measured from table can also be watched. Monitor this on its panel sets up a monitor on that table. Nothing is watched until someone does that. See Monitors.
Where it lives in Querri
Section titled “Where it lives in Querri”Your KPIs are listed under the Metrics tab in the Library. A KPI’s own panel calls it a KPI. With a panel open, the tab can fold into More.
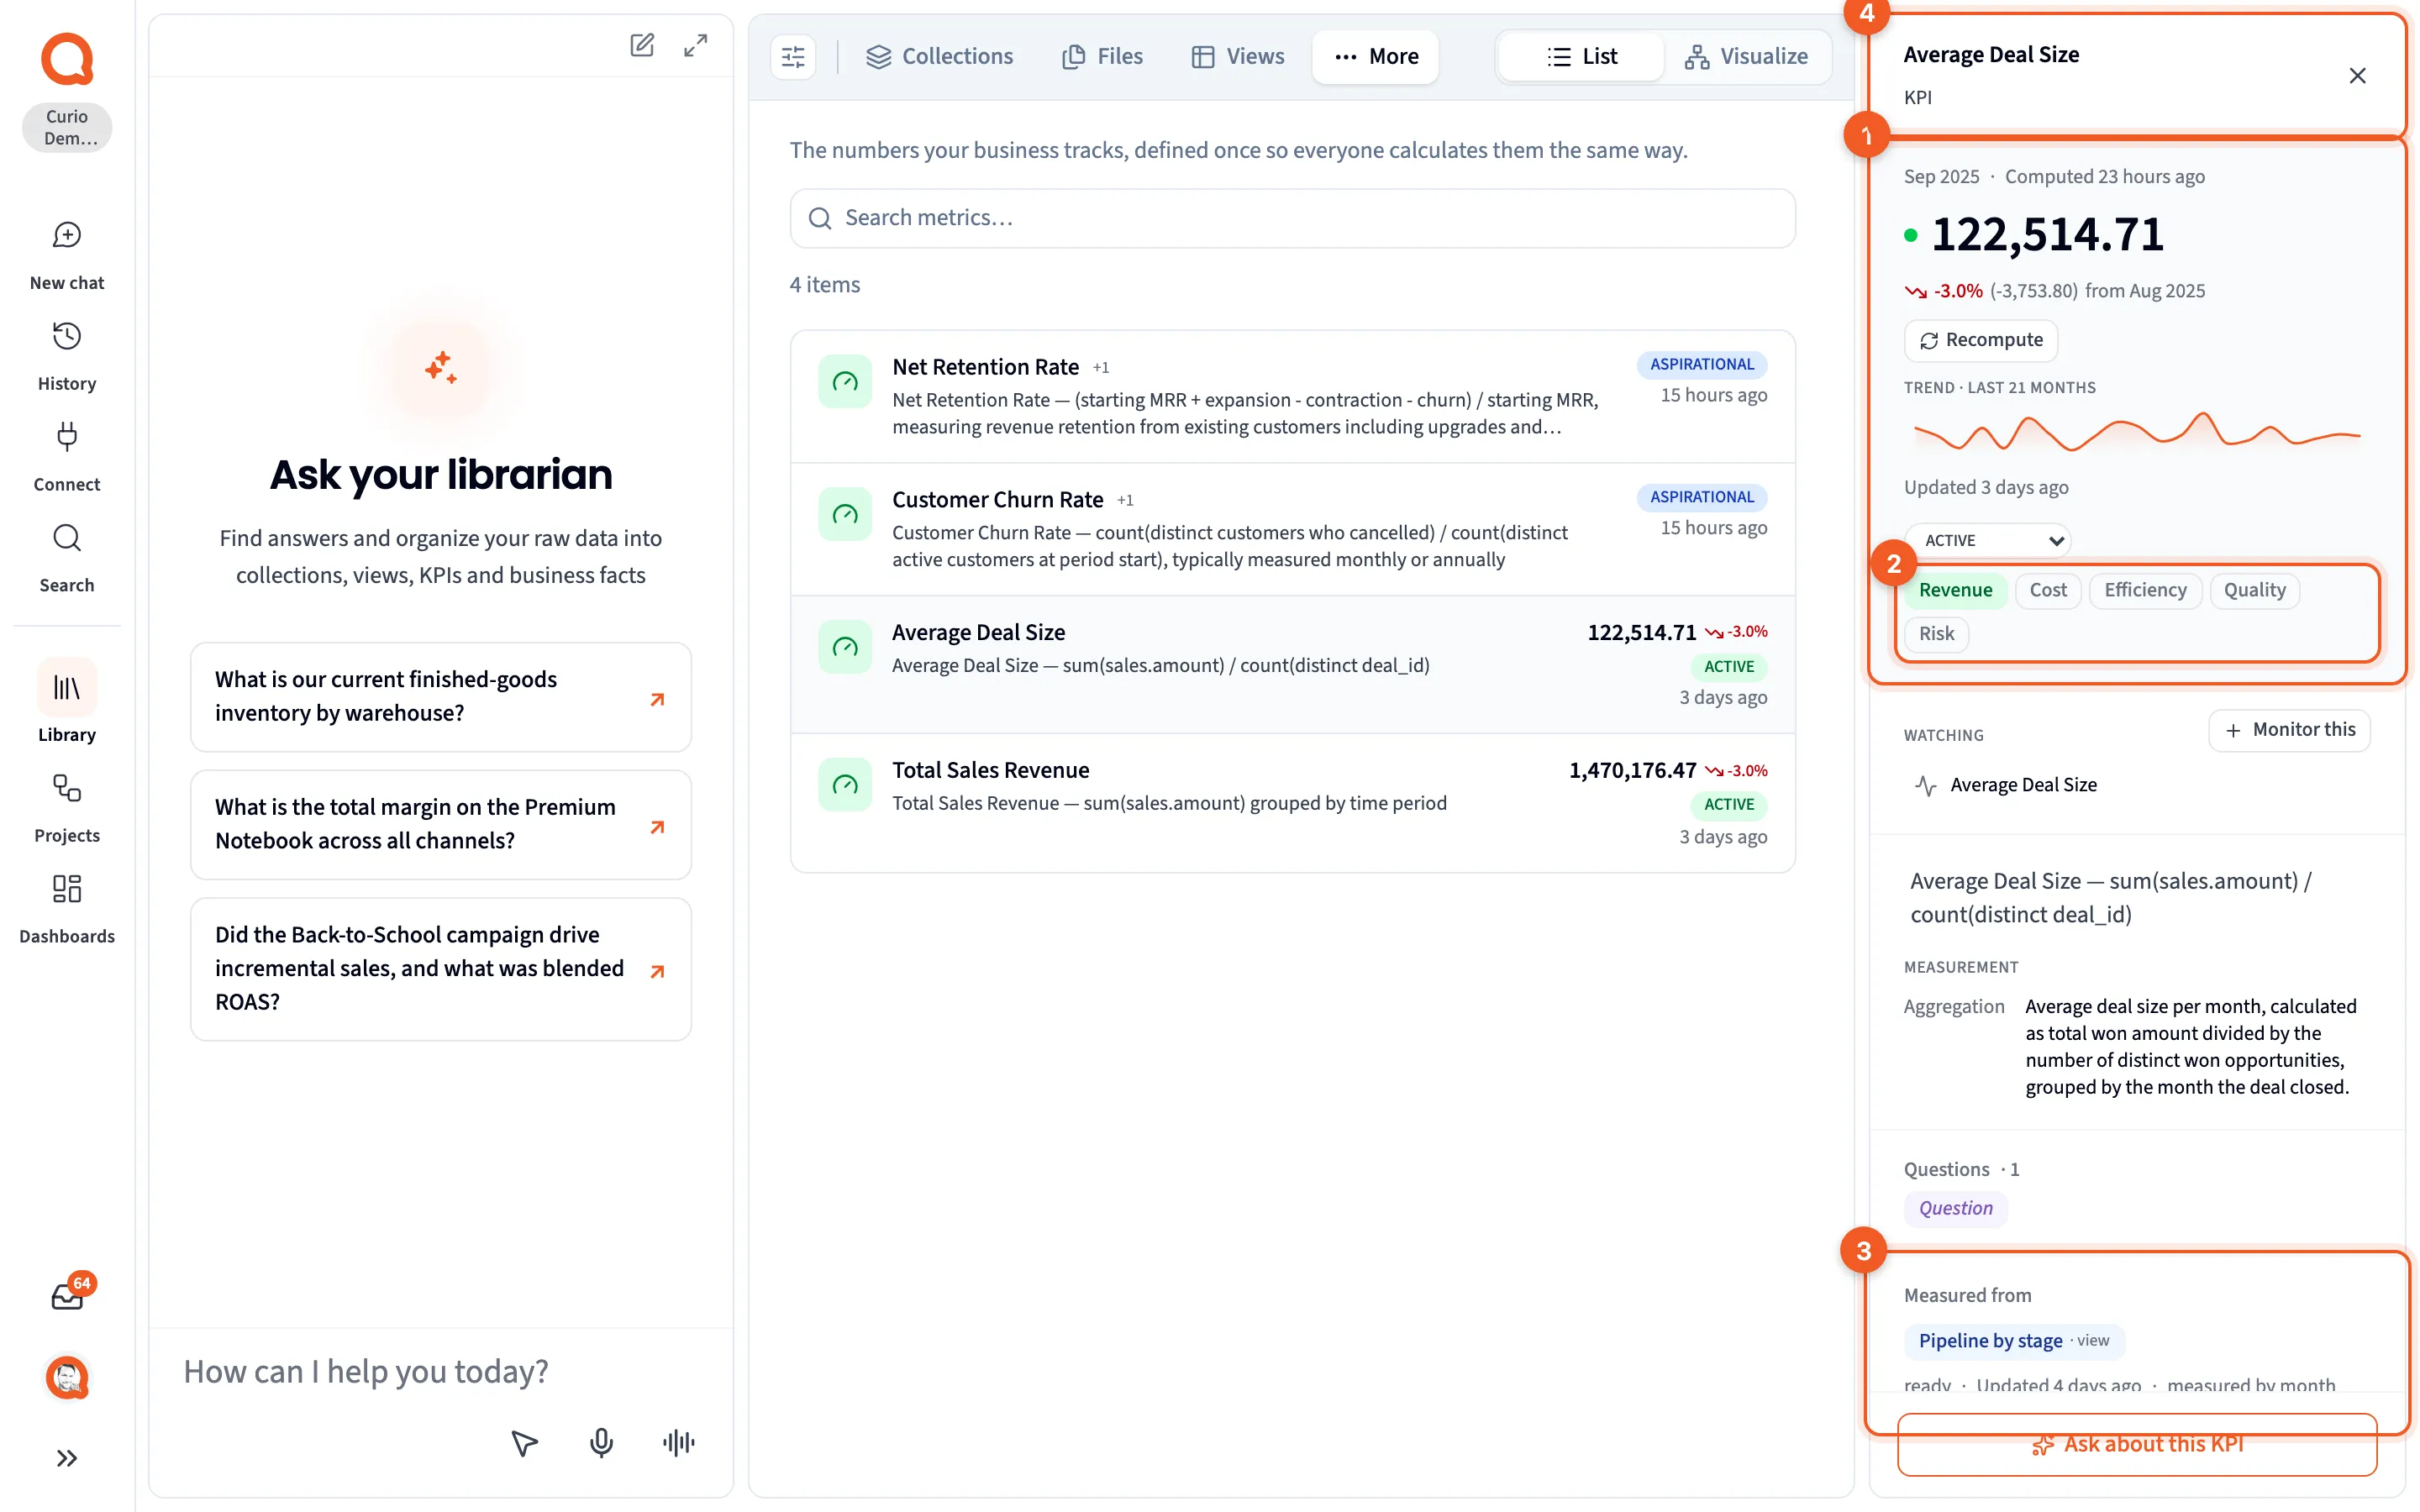
- The value: the latest value and its period, the change from the period before, and the trend. Recompute calculates it again.
- The five dimensions: the lit ones are this KPI’s. Here that’s only Revenue.
- Measured from: the one table the value comes from, here the view Pipeline by stage.
- The header: the KPI’s name, marked KPI.
In the list, each KPI’s icon is colored by its first dimension, and +1 means it counts toward one more. On the Visualize map, KPIs are yellow diamonds and each dimension is an orange diamond, with lines linking a KPI to its dimensions. Questions are orange too, but they’re drawn as rows and boxes, never diamonds. KPI panel covers the rest of the panel.
Next steps
Section titled “Next steps”- Choose the KPIs to track puts this into practice.
- One number, one definition shows how KPIs, views and facts keep a number consistent.
- Views covers the tables a KPI is often measured from.