
Replace a weekly manual report
Esta página aún no está disponible en español. Se muestra la versión en inglés.
Build your weekly report once, and let Querri run it, send it and keep a dashboard current, so nobody rebuilds it by hand on Monday morning.
Before you start
Section titled “Before you start”- Permissions: only a project’s owner sees Schedule, and only the owner can put its charts on a dashboard. A dashboard’s owners and editors can use its Automate. Only admins set up Message Delivery.
- Data you need: the tables behind the report, connected or uploaded. The example uses Curio’s Shopify orders and refunds. A scheduled run reads Querri’s copy of your data, so give each connector a sync that runs before the report. See Sources and connectors.
- Credits this uses: each message you send while building the report uses a credit. Each scheduled run costs one credit per 10 steps that ran, at least one, charged to your organization. A test run you start yourself doesn’t. See Credits.
1. Build the report in a project
Section titled “1. Build the report in a project”Start a project and ask for the report one piece at a time, the way you’d brief an analyst:
Load the Curio tables shopify_orders and shopify_refunds.
Join shopify_refunds to shopify_orders on order_id and work out weekly net revenue: order totals minus refunds.
Chart weekly net revenue as a line chart, and add a table of the latest week’s totals.
Check each result before you ask for the next. See Checking where a chart came from. Curio’s data stops in September 2025, so its latest week is in September 2025, not this week.
2. Decide how people get it
Section titled “2. Decide how people get it”Would your team rather get an email or open a page? A project can do either, or both.
To email it, ask:
Email the weekly net revenue chart and an Excel workbook of the weekly totals to sales@example.com.
Querri adds an Excel Export step for the workbook and a Deliver step for the email. Building a Deliver step only previews the email, and its message lists everyone it would go to. Point it at your own address while you test.
To give people a page to open instead, ask:
Create a dashboard from this analysis for the sales team, with the weekly net revenue chart and the totals table.
The dashboard is saved to Private, with only you as owner, until you share it.
For a version per person, like each sales rep’s own numbers, see Loop.
3. Schedule the project
Section titled “3. Schedule the project”In the Data Flow, click Schedule.
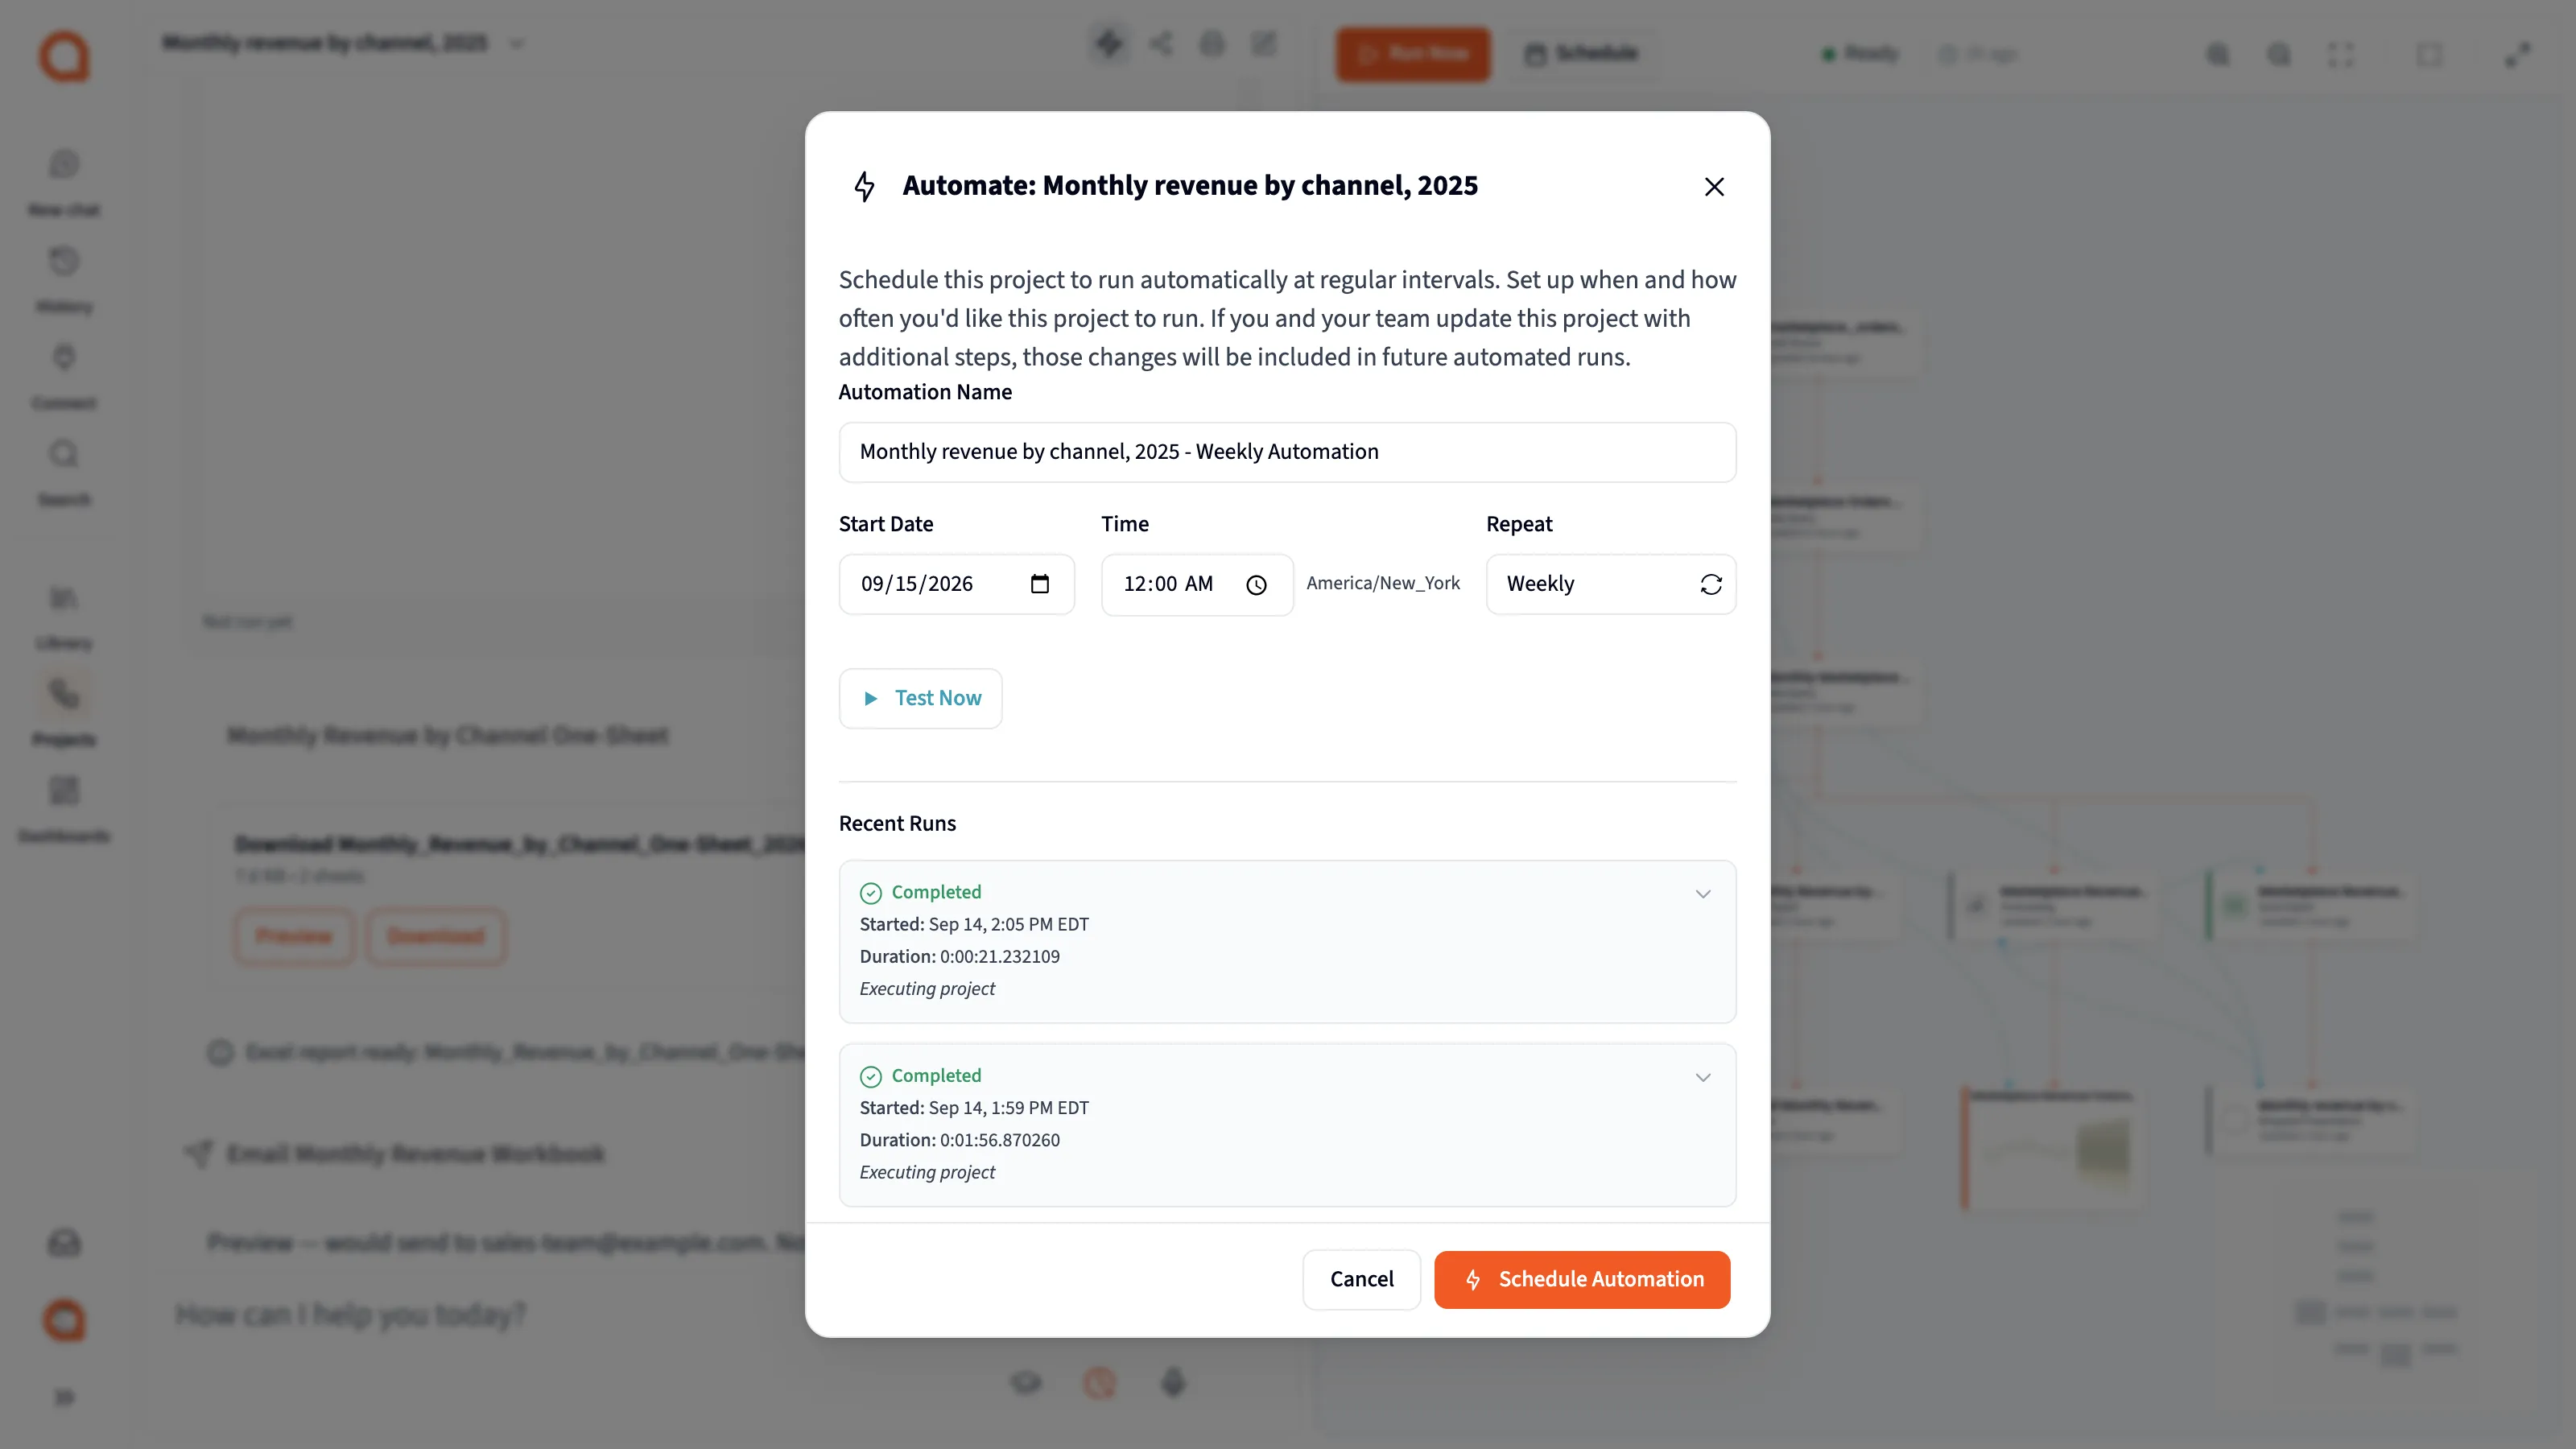
- Automation Name: what the schedule is called.
- Repeat: how often it runs.
- Test Now: run it once now.
- Schedule Automation: save the schedule.
To set it up:
- Give it an Automation Name.
- Pick a Start Date and a Time, which is in your browser’s time zone.
- Set Repeat to Weekly.
- Click Schedule Automation.
Weekly always runs on Monday, counted in UTC, so a late-evening time can land on a different day where you are.
Each run includes every export, and its Deliver steps send their emails. Test Now runs the project once straight away, and it sends the emails too. Recent Runs lists the last 7 days.
4. Keep the dashboard current
Section titled “4. Keep the dashboard current”A dashboard has no refresh button. Its Automate, in the dashboard’s header, runs the projects that feed it again on a schedule, Daily, Weekly or Monthly. See Automate.
A dashboard refresh runs its projects the same way a scheduled run does, Deliver steps included. If the project has its own schedule too, the emails can go out twice. Pick one: schedule the project, or automate the dashboard and let its refresh send the email.
5. Share it
Section titled “5. Share it”Open the dashboard and click Share.
- To give named people access, search for them, pick Viewer so they can look and use filters, and click Invite.
- To publish a page anyone with the link can open, click Create Link under Shared Pages. Set an Expiration, and add Password protection if the numbers are sensitive. Visitors see the data you’re allowed to see.
Only the dashboard’s owner manages its public links. See Sharing and automating dashboards. The people on a Deliver step’s list don’t need a Querri account at all.
6. Send from your own address
Section titled “6. Send from your own address”This one is optional.
Deliver emails come from Querri’s usual sender. An admin can set up Message delivery to send them from your organization’s own address instead, and send a test email there before the first run.
Check your work
Section titled “Check your work”- Recent Runs shows your test run as Completed.
- The Deliver step’s message starts “Sent to” and names the right people.
- The workbook and chart show the latest week.
- The dashboard’s numbers match the email’s.
Troubleshooting
Section titled “Troubleshooting”No email arrived. Read the Deliver step’s message. One that starts “Preview” hasn’t sent, which is normal for a step Querri just built. One that starts “Delivery failed” says why.
The numbers didn’t change. A run only redoes the steps built on a source with new data. Check that the connector synced before the report ran.
It ran on the wrong day. Weekly means Monday in UTC, so pick a Time that’s Monday there too.
Everyone got two emails. The project’s schedule and the dashboard’s Automate both ran it. Delete one of the two automations.
A run failed. Open the project’s Data Flow and find the red step. See When a step fails.