
Results
Every step in a project produces a result: a table, a chart, a number, a file or a presentation. It lands as a card in project chat, where you can download it, refine it, or open it full size with the explanation and code behind it.
Who can see this: anyone who can open the project. Renaming, refining and deleting a step need editor access.
A result card
Section titled “A result card”- The step’s title: click it to rename the step.
- Copy: copy the rows.
- Download: save the result as a file.
- Total Rows: how many rows the table has.
A card shows the step’s tool icon, title and menu, then the result. Tables load more rows as you scroll. Under a chart or text result, a line sums it up, with Learn More and Refine beside it.
A result that can’t be fetched says “Couldn’t load this result.” with a Retry. If it still can’t be fetched, it says so, and offers Open the project where that helps.
Point at a card for Copy (tables only), Add to Dashboard, Download and Maximize. The tool icon in the card’s header is Show in data flow, which takes you to that step on the canvas; clicking elsewhere on the card no longer does it. Tables download as CSV, Excel, Parquet or Markdown, charts as PNG or SVG, and text as HTML or Markdown. The card’s menu adds Rename, Export Settings, Refine and Delete. A table’s column menu sorts, pins, hides, wraps or moves a column, or changes its type.
An Excel Export card has Preview and Download, and a Wrapped step shows the deck itself. To put a result on a dashboard, see Add to Dashboard.
Maximize
Section titled “Maximize”- The result, full size. Charts here are interactive.
- Table info: the dataset, rows and columns.
- Explanation: how the step got its result.
- Code: the query or script behind it.
Maximize opens the result full size, with a details panel you can close with Hide Details:
- Table info: the dataset, its rows and columns, and which columns show.
- Result summary: what the result says.
- Caveats: what to keep in mind. These only appear here, never on the card.
- Explanation: written out as you watch.
- Code: the query or script that built the result, which you can copy.
If a step has been refined, arrows at the top move between its versions, and Restore this version brings back an older one. The refine box sits at the bottom.
Checking where a chart came from
Section titled “Checking where a chart came from”Before you pass a chart on, trace it back. Revenue, for one, can be counted more than one way, and the code shows which way this step used.
- Maximize the chart. Read the Result summary and Caveats, then the Explanation and Code.
- Open Show data flow and find the chart’s Visualization step. Follow its lines up through the query steps to the Load Source steps it started from.
- Maximize any step along the way to check it the same way.
A chart on a dashboard can link back to its project, but the link opens the project chat, not the step. Open the Data Flow and find the step there.
For an answer in Librarian chat, see Check an answer before you share it.
Refining a result
Section titled “Refining a result”- The refine box: describe the change you want.
Refine, on the card, in its menu or under a table, opens Maximize with the refine box ready. Describe the change, such as “Add a trend line” or “Sort by date”, and send it.
- Only this step runs again. Steps built on it keep their earlier results until they run again, for example with Run from here in the Data Flow.
- Some changes need an earlier step. Then a dialog says “This change needs an upstream step”, with a prompt you can edit and Send to main chat.
- The old result isn’t lost. The new one replaces it, and the old one stays in the step’s versions.
- Cost: a refinement that works counts as a Step refinement, half a credit. One that fails costs nothing.
When a step fails
Section titled “When a step fails”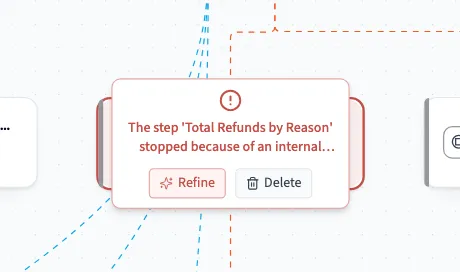
A failed step turns red in the Data Flow, and its card in the chat reads Step Processing Failed, with a plain message about what went wrong. A step that ran too long, for example, says it “took too long to finish and was stopped” and suggests narrowing the request. A step that needs a table the project never loaded says so, and tells you to load the table and rebuild the step, because running it again as it is would give the same result.
- Refine lets you describe a fix, and Delete removes the step. Both need editor access.
- Steps waiting on it read Blocked, or say they were canceled because a parent step failed, with Retry, which opens the refine box.
- The project may try again by itself, adding new steps beside the failed ones. The failed steps stay until someone deletes them.
- A step that worked but found nothing says “This step has zero rows of data.”
Your question still counts as one credit when a step in it fails.