
Projects
A project is where a deeper analysis happens. You ask in plain language, the project loads data, queries it and draws charts, and every result becomes a step you can check, run again and schedule.
Who can see this: everyone who’s signed in. Viewers of a project can read it, editors can also run and change its steps, and owners share and schedule it.
Read the transcript
What a project is for
A Querri project is where you go deeper: work through an analysis step by step, see exactly how every number was built, and run it again on a schedule.
Start a project
There are two ways to start one. Ask the Librarian for a trend, a forecast, or a dashboard, and it offers to open a project, with your files and question already filled in. Or start one yourself, from Projects, or from files you pick in the Library.
Work through an analysis in the chat
Inside the project, you just keep asking. Querri turns each request into steps: it pulls in your sources, cleans them up, and joins them together… and every follow-up builds on the steps before it. Ask it to filter to last quarter, group sales by region, fix inconsistent names, or combine orders with refunds. It draws the charts you ask for, and many other kinds of visualizations.
Follow every step in the data flow
Every step lands in the data flow, so you can see exactly how a number was built. Select a step to refine it, add it to a dashboard, or save it as a skill you can reuse.
Use specialized tools
When a question needs more, projects bring specialized tools: forecasts, statistical tests, financial statements, and AI that reads every row. Then package it up as a formatted Excel workbook, or a Wrapped presentation.
Run it again on a schedule
And projects are repeatable. Run one again to pick up new data, or schedule it hourly, daily, weekly, or monthly… Steps your team adds later are included too. Add a Deliver step, and each run can email the results, even one tailored report per person with the Loop tool. Start with a question you answer every month… build it once in a project, and let Querri run it for you.
The projects list
Section titled “The projects list”- New Project: choose how to start.
- Import: bring in a
.qpproject file. - Date modified: sort the list.
- A project card: open the project.
Projects in the app rail lists every project you can open across your organization, whichever workspace you’ve picked. Search by name, or sort by Date modified, Name or Status.
A card shows its status (New, In Progress, Completed or Error), when it was edited, who has access, its number of steps and automations, and a pill naming the workspace it lives in. Point at a card for its buttons:
- Edit project changes the name and the Project Goal, Description and Context.
- Delete project, for the person who created it, removes the project, its steps and automations, and any dashboard widgets built from it.
- Leave project, for everyone else, removes your access.
Starting a project
Section titled “Starting a project”New Project doesn’t make a project. It opens a panel asking How do you want to start?, and nothing is created until you pick a path.
| Card | What pressing it does |
|---|---|
| Start from a screenshot | Rebuilds a picture of a report or dashboard as project steps. See Build a dashboard from a picture |
| Describe what you want | Puts your description in the box and starts the project from it |
| Choose from your Library | Starts from files you pick |
Under them sit three quieter buttons: Start with an empty project, which is what New Project used to do on its own, Import a .qp for a project file, and Show my projects to close the panel.
- How do you want to start?: the heading.
- Start from a screenshot: rebuild a picture as steps.
- Describe what you want: start from a description.
- Choose from your Library: start from files you pick.
- Start with an empty project: an empty project, straight away.
A project you make is saved to the workspace you last worked in, or to Private if you aren’t a member there. Choosing a path costs nothing; only the questions that follow cost credits.
Librarian chat can also offer one when a question needs more than a quick answer.
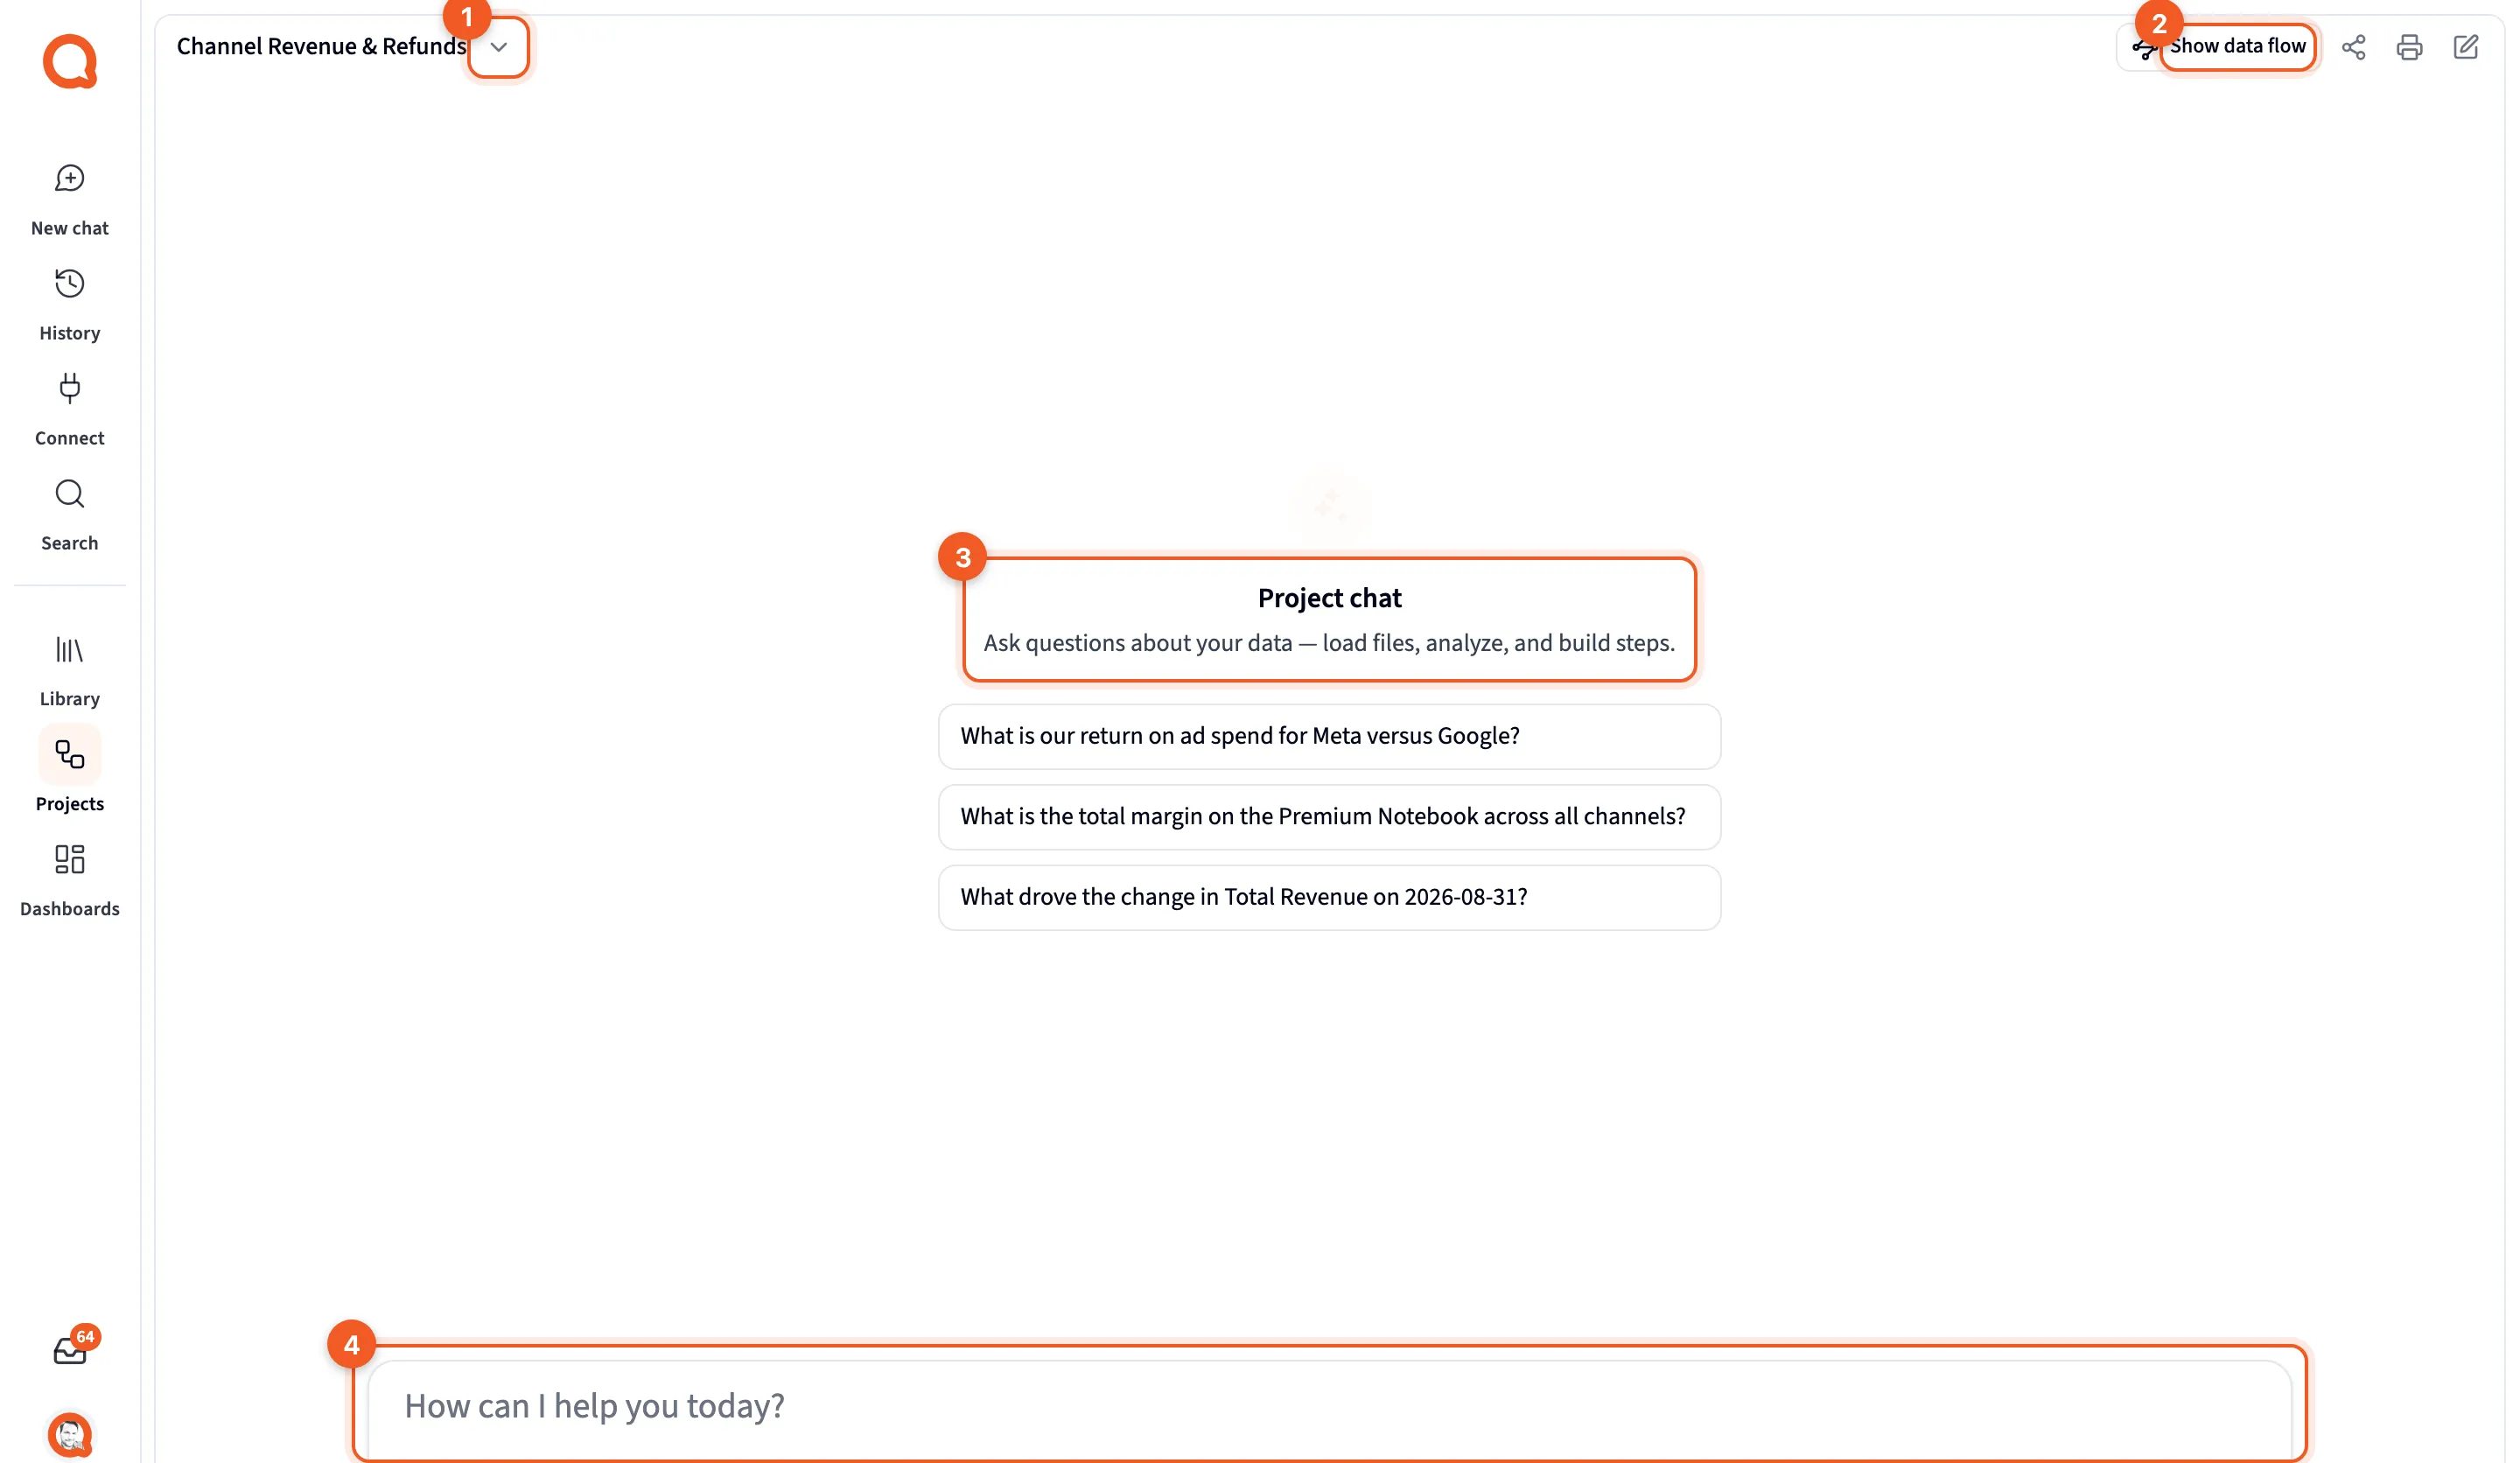
- The project’s name, with a menu for Pin, Rename and Delete. Delete removes this chat, not the project or its steps.
- Show data flow: open the graph of steps.
- Project chat: starter questions you can click.
- The composer: ask for analysis here.
Project chat
Section titled “Project chat”Ask the way you’d ask an analyst, one piece at a time: “Load the Curio sales tables shopify_orders and shopify_refunds”, then “Join refunds to orders and work out net revenue per order”. Each request runs as steps, and tables and charts land in the chat as result cards.
- Load skills into context adds skills to this chat.
- Think longer and harder, the clock icon, only appears in project chats. Lit, “Answers are checked and retried before you see them.” Off, “Answers come back in one pass, unchecked.”
A project chat answers one question at a time. Send another while it’s working and Querri says “Still working on the previous message. Send yours again when it finishes.” If an answer lands after you’ve moved on, the chat tells you it’s ready rather than dropping it, with Show it to jump to it.
If a step needs a table this project never loaded, and the name matches one source you can reach, the project adds the Load Source step itself rather than refusing. The step says it was added automatically and which step needed it.
Each message counts once as a Question answered in a project, one credit, however many steps it runs. See Credits.
The Data Flow
Section titled “The Data Flow”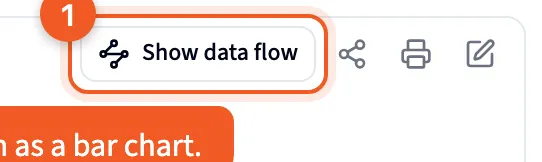
- Show data flow: open the graph beside the chat.
The Data Flow draws every step as a graph, so the project can run again without anyone asking again. It starts closed each time you open the project.
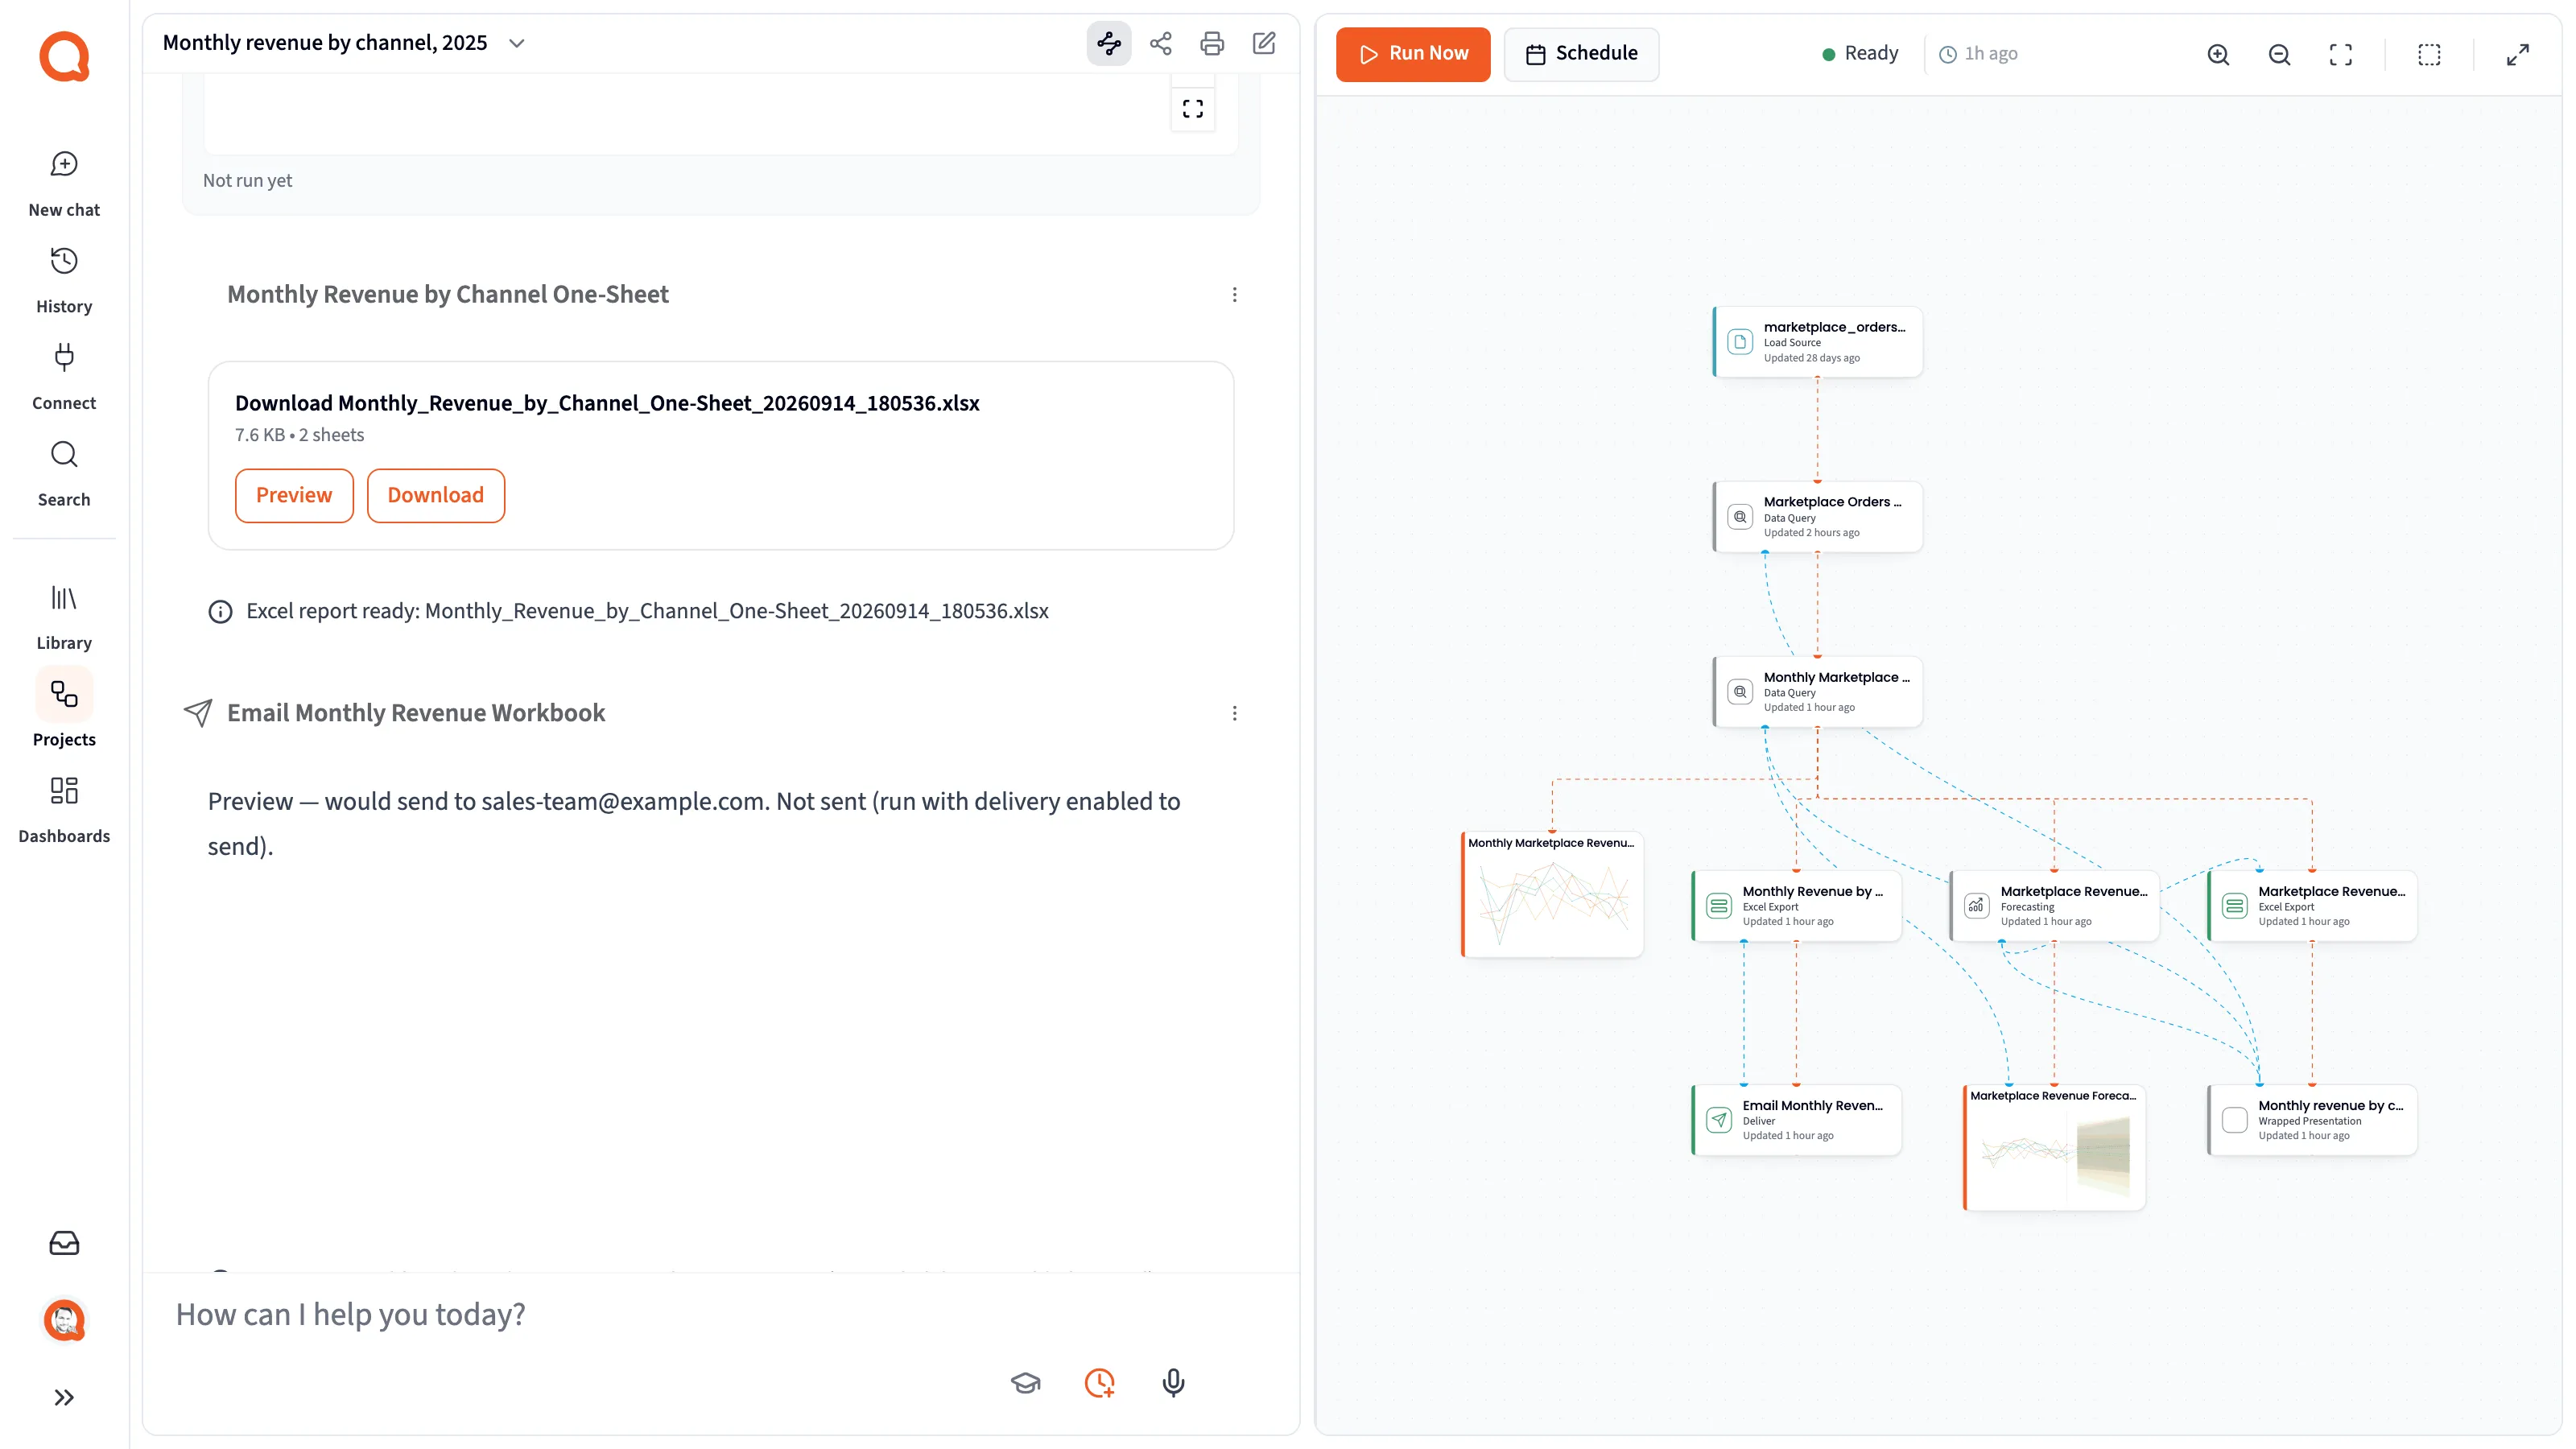
- The chat, where you ask.
- The toolbar: Run Now, Schedule and the project’s status.
- A dashed line: a table joined into a step.
- A Visualization step: a chart.
Each step shows its name, its tool, such as Load Source, Data Query, Multi-Table Query or Visualization, and when it was updated. Lines run from each step to the steps built on it, and dashed lines show tables joined in. A red step has failed, and steps waiting on it read Blocked. See When a step fails.
Point at a step for Download, Add to Dashboard, Expand, Refine and More, which has Rename, Run from here, Duplicate Step and Delete. Deleting a step deletes the steps built on it too.
To put a step’s chart on a dashboard, with Add to Dashboard or by dragging it from project chat, see Getting charts onto a dashboard.
Running it again
Section titled “Running it again”Run Now opens Run project, where you choose what the run does:
- Refresh Sources from Library is ticked. Querri checks each source for new data, and only the steps built on a source that changed run again. If no source changed, nothing else runs.
- Process Exports and Deliver Messages start unticked, so a run sends no files or emails unless you tick them.
Options only appear for the kinds of step the project has. While it runs, the toolbar shows which step it’s on, and Run Now becomes Cancel. Only editors and owners can run a project.
A project runs one at a time. Start a second run while one is going and you get Execution in progress, saying another execution is already running, with Force cancel the current run, or dismiss to wait. Dismiss waits. Force Cancel & Retry stops the run that’s in the way, whoever started it, and then starts yours. Steps that already finished are kept. Use it when a run looks stuck rather than to jump a queue, because the run you stop is somebody’s work.
Scheduling
Section titled “Scheduling”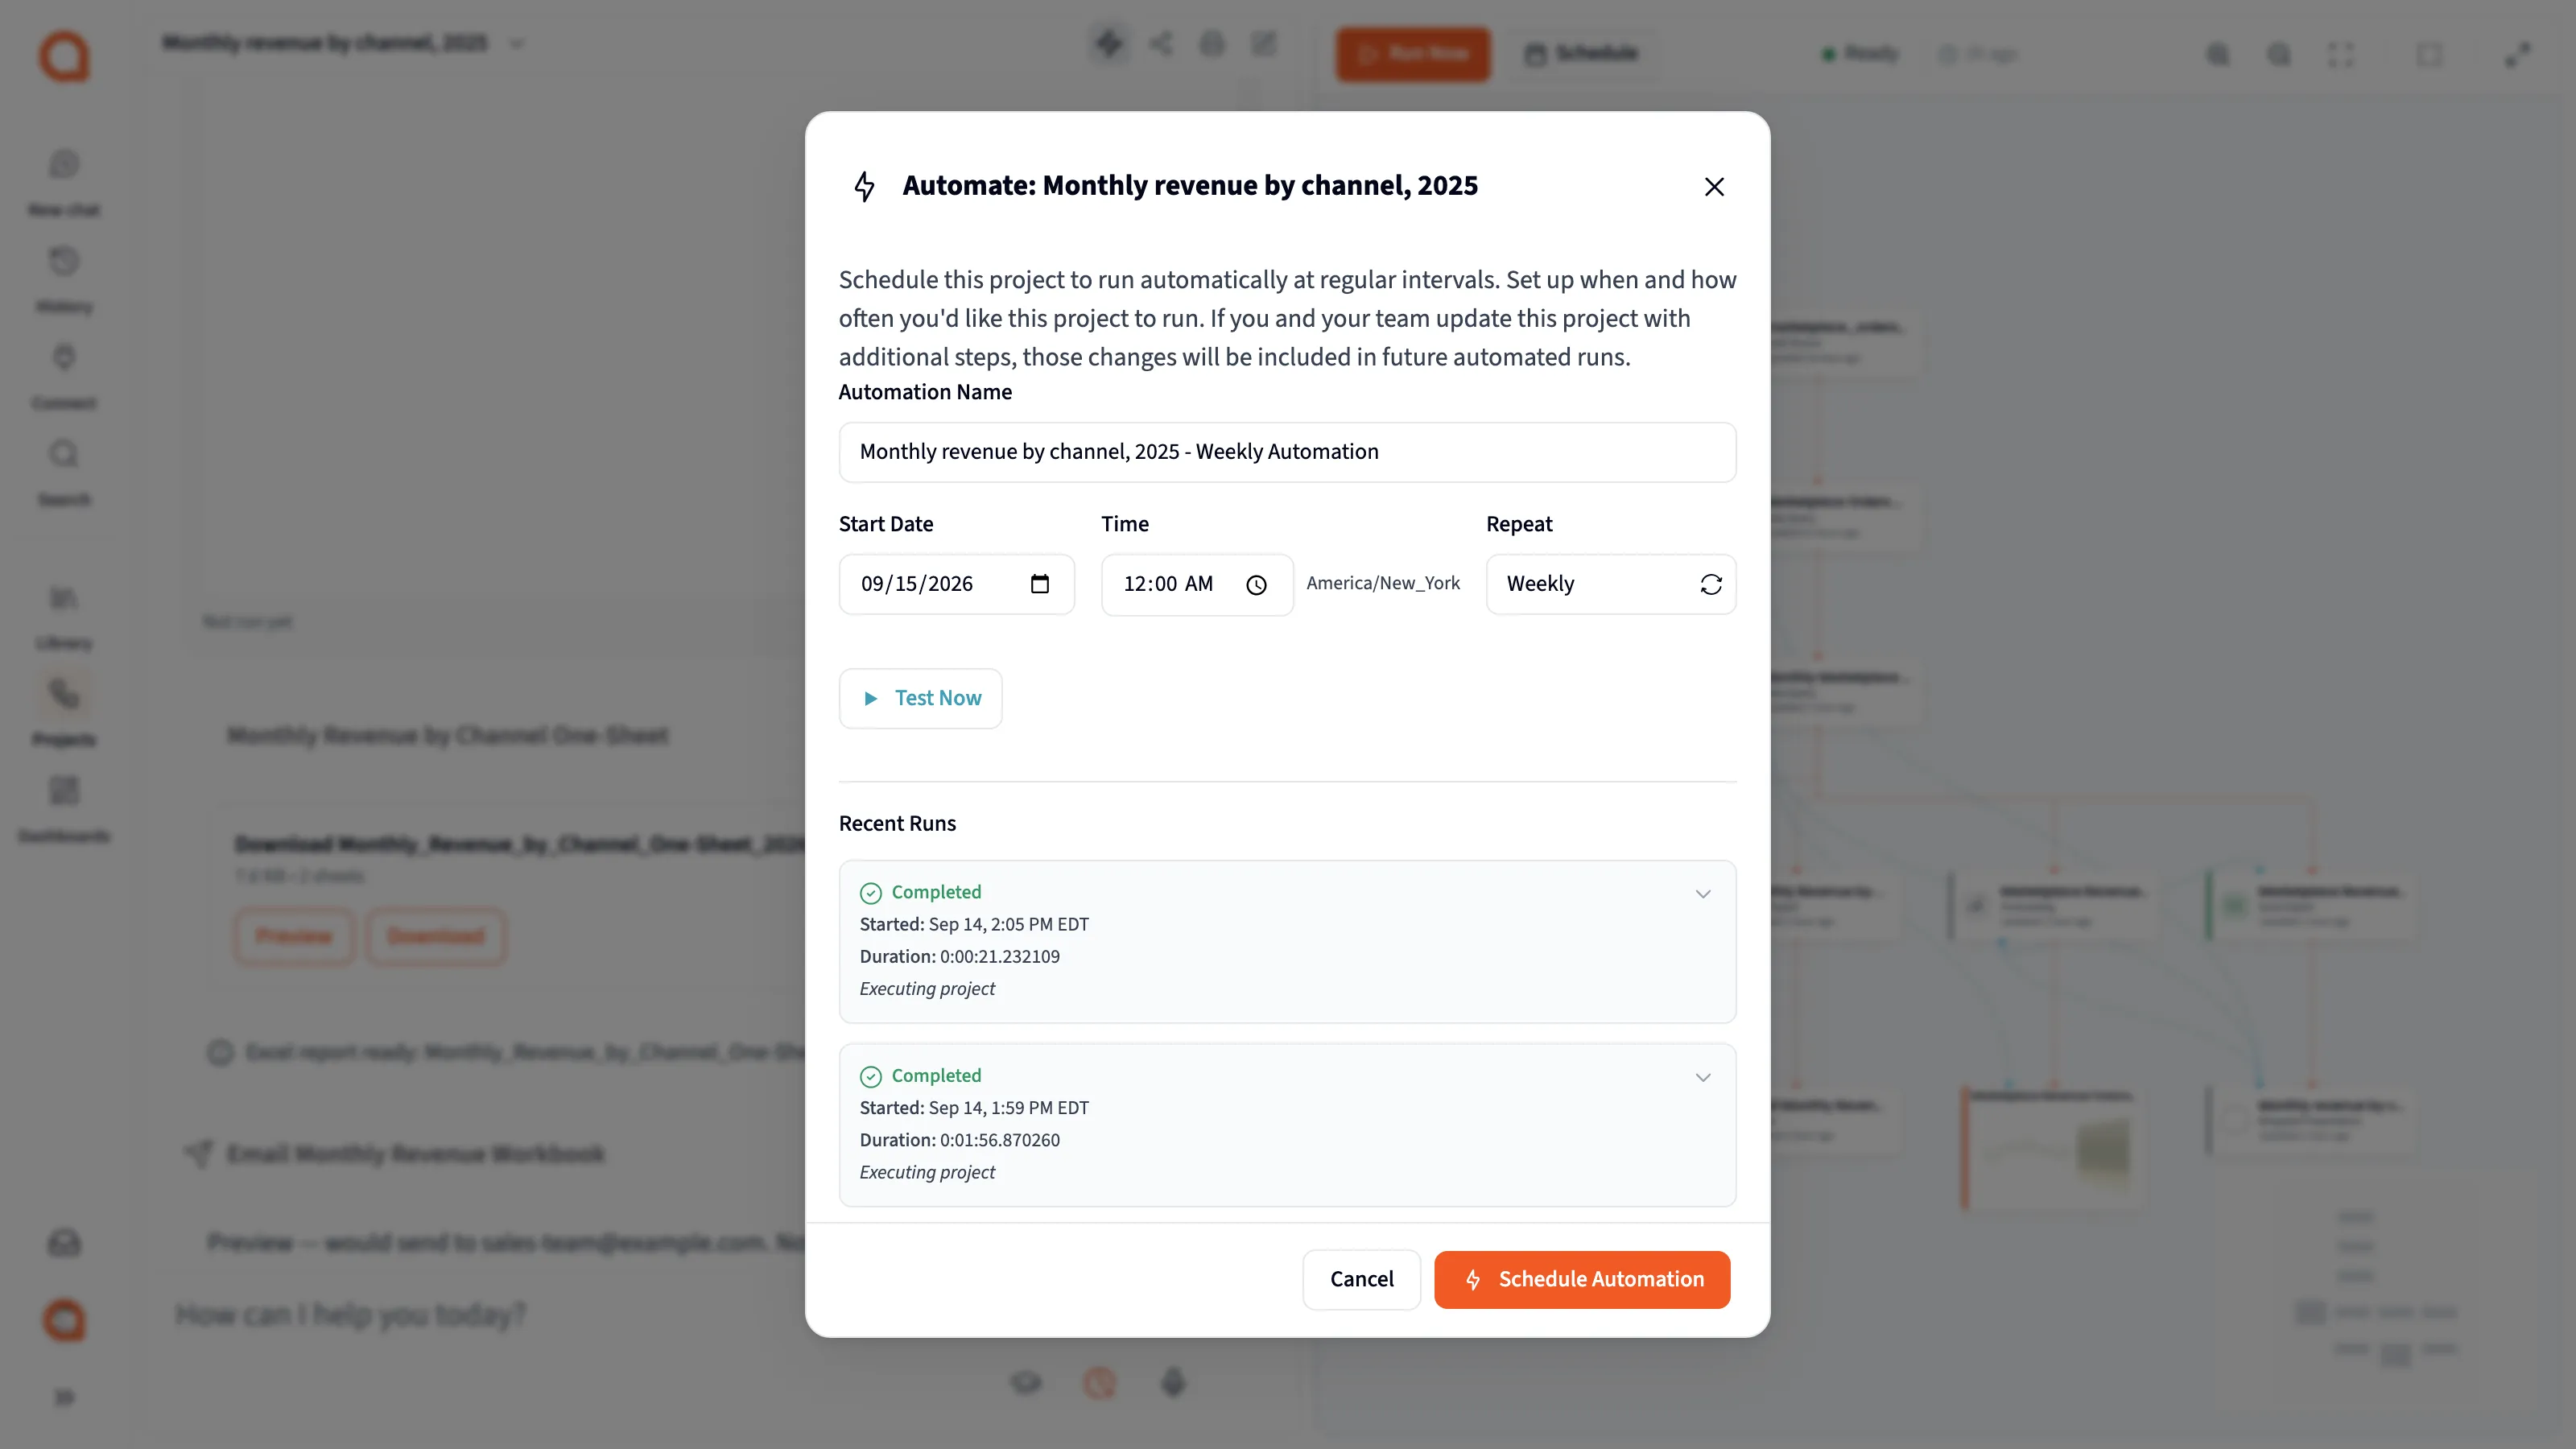
- Automation Name.
- Repeat: how often it runs.
- Test Now: run it once now.
- Schedule Automation: save the schedule.
Schedule, which only the owner sees, opens a dialog titled “Automate:” and the project’s name. Pick a Start Date, a Time in your browser’s time zone, and Repeat: Hourly, Daily, Weekly or Monthly. Weekly always runs on Monday and Monthly on the 1st, counted in UTC, so a late-evening time can fall on a different day where you are.
Test Now runs the project once, now, and like a scheduled run it sends email from any Deliver steps. Recent Runs lists the last 7 days.
A scheduled run runs the whole project, including steps added since you scheduled it, with every export, and Deliver steps send their emails. It costs one credit per 10 steps that ran, at least one, charged to your organization. A run where no steps ran costs nothing.
Sharing
Section titled “Sharing”- Add people.
- People with access.
- Public links.
- Create Link.
Anyone can open the share dialog from the project header, but only owners can add people, change access or make links. Editors see Public links too, but creating a link fails for them.
- Add people: search for someone, pick viewer, editor (picked at first) or owner, and click Invite. An address outside your organization gets an invitation.
- People with access: change a role, or Remove access.
- Public links: Create Link shares the Full Chat or a Single Response. Links expire after 30 days unless you pick 7 days, 90 days or never, and you can add a password. Anyone with the link sees your data, filtered by your security policies.
There’s no option to share with the whole organization. See Workspaces and privacy.
Presentations, Excel and other tools
Section titled “Presentations, Excel and other tools”Ask for a presentation and the project adds a Wrapped Presentation step, a slide deck made from your charts and tables. Ask for a formatted Excel report and it adds an Excel Export step, a workbook with a sheet for each step you name. See Wrapped and Excel Export.
Ask to email a result and it adds a Deliver step, which only previews the email until you send it. See Deliver. Ask for the same thing for each customer, region or rep and it adds a Loop, which repeats the steps once per row. See Loop.
Other steps work the same way: Forecasting, Statistics, Researcher, Categorize, Financial Statements and Scheduling, which plans shifts and resources rather than scheduling the project.