
Table and column panels
Esta página aún no está disponible en español. Se muestra la versión en inglés.
Views and source tables get a detail panel built around their data: how many rows there are, what’s in each column, where the data came from, and what uses it. From either one you can open a single column, and that’s where you write a fact yourself.
Who can see this: anyone with access to the table. If your access covers only some of a table’s rows, the panel tells you.
These panels use the same header, chips and Ask about this footer as every other panel. See Detail panels.
Open a view from the Views tab, from a collection page, or by clicking a View name on the Files tab. See Views.
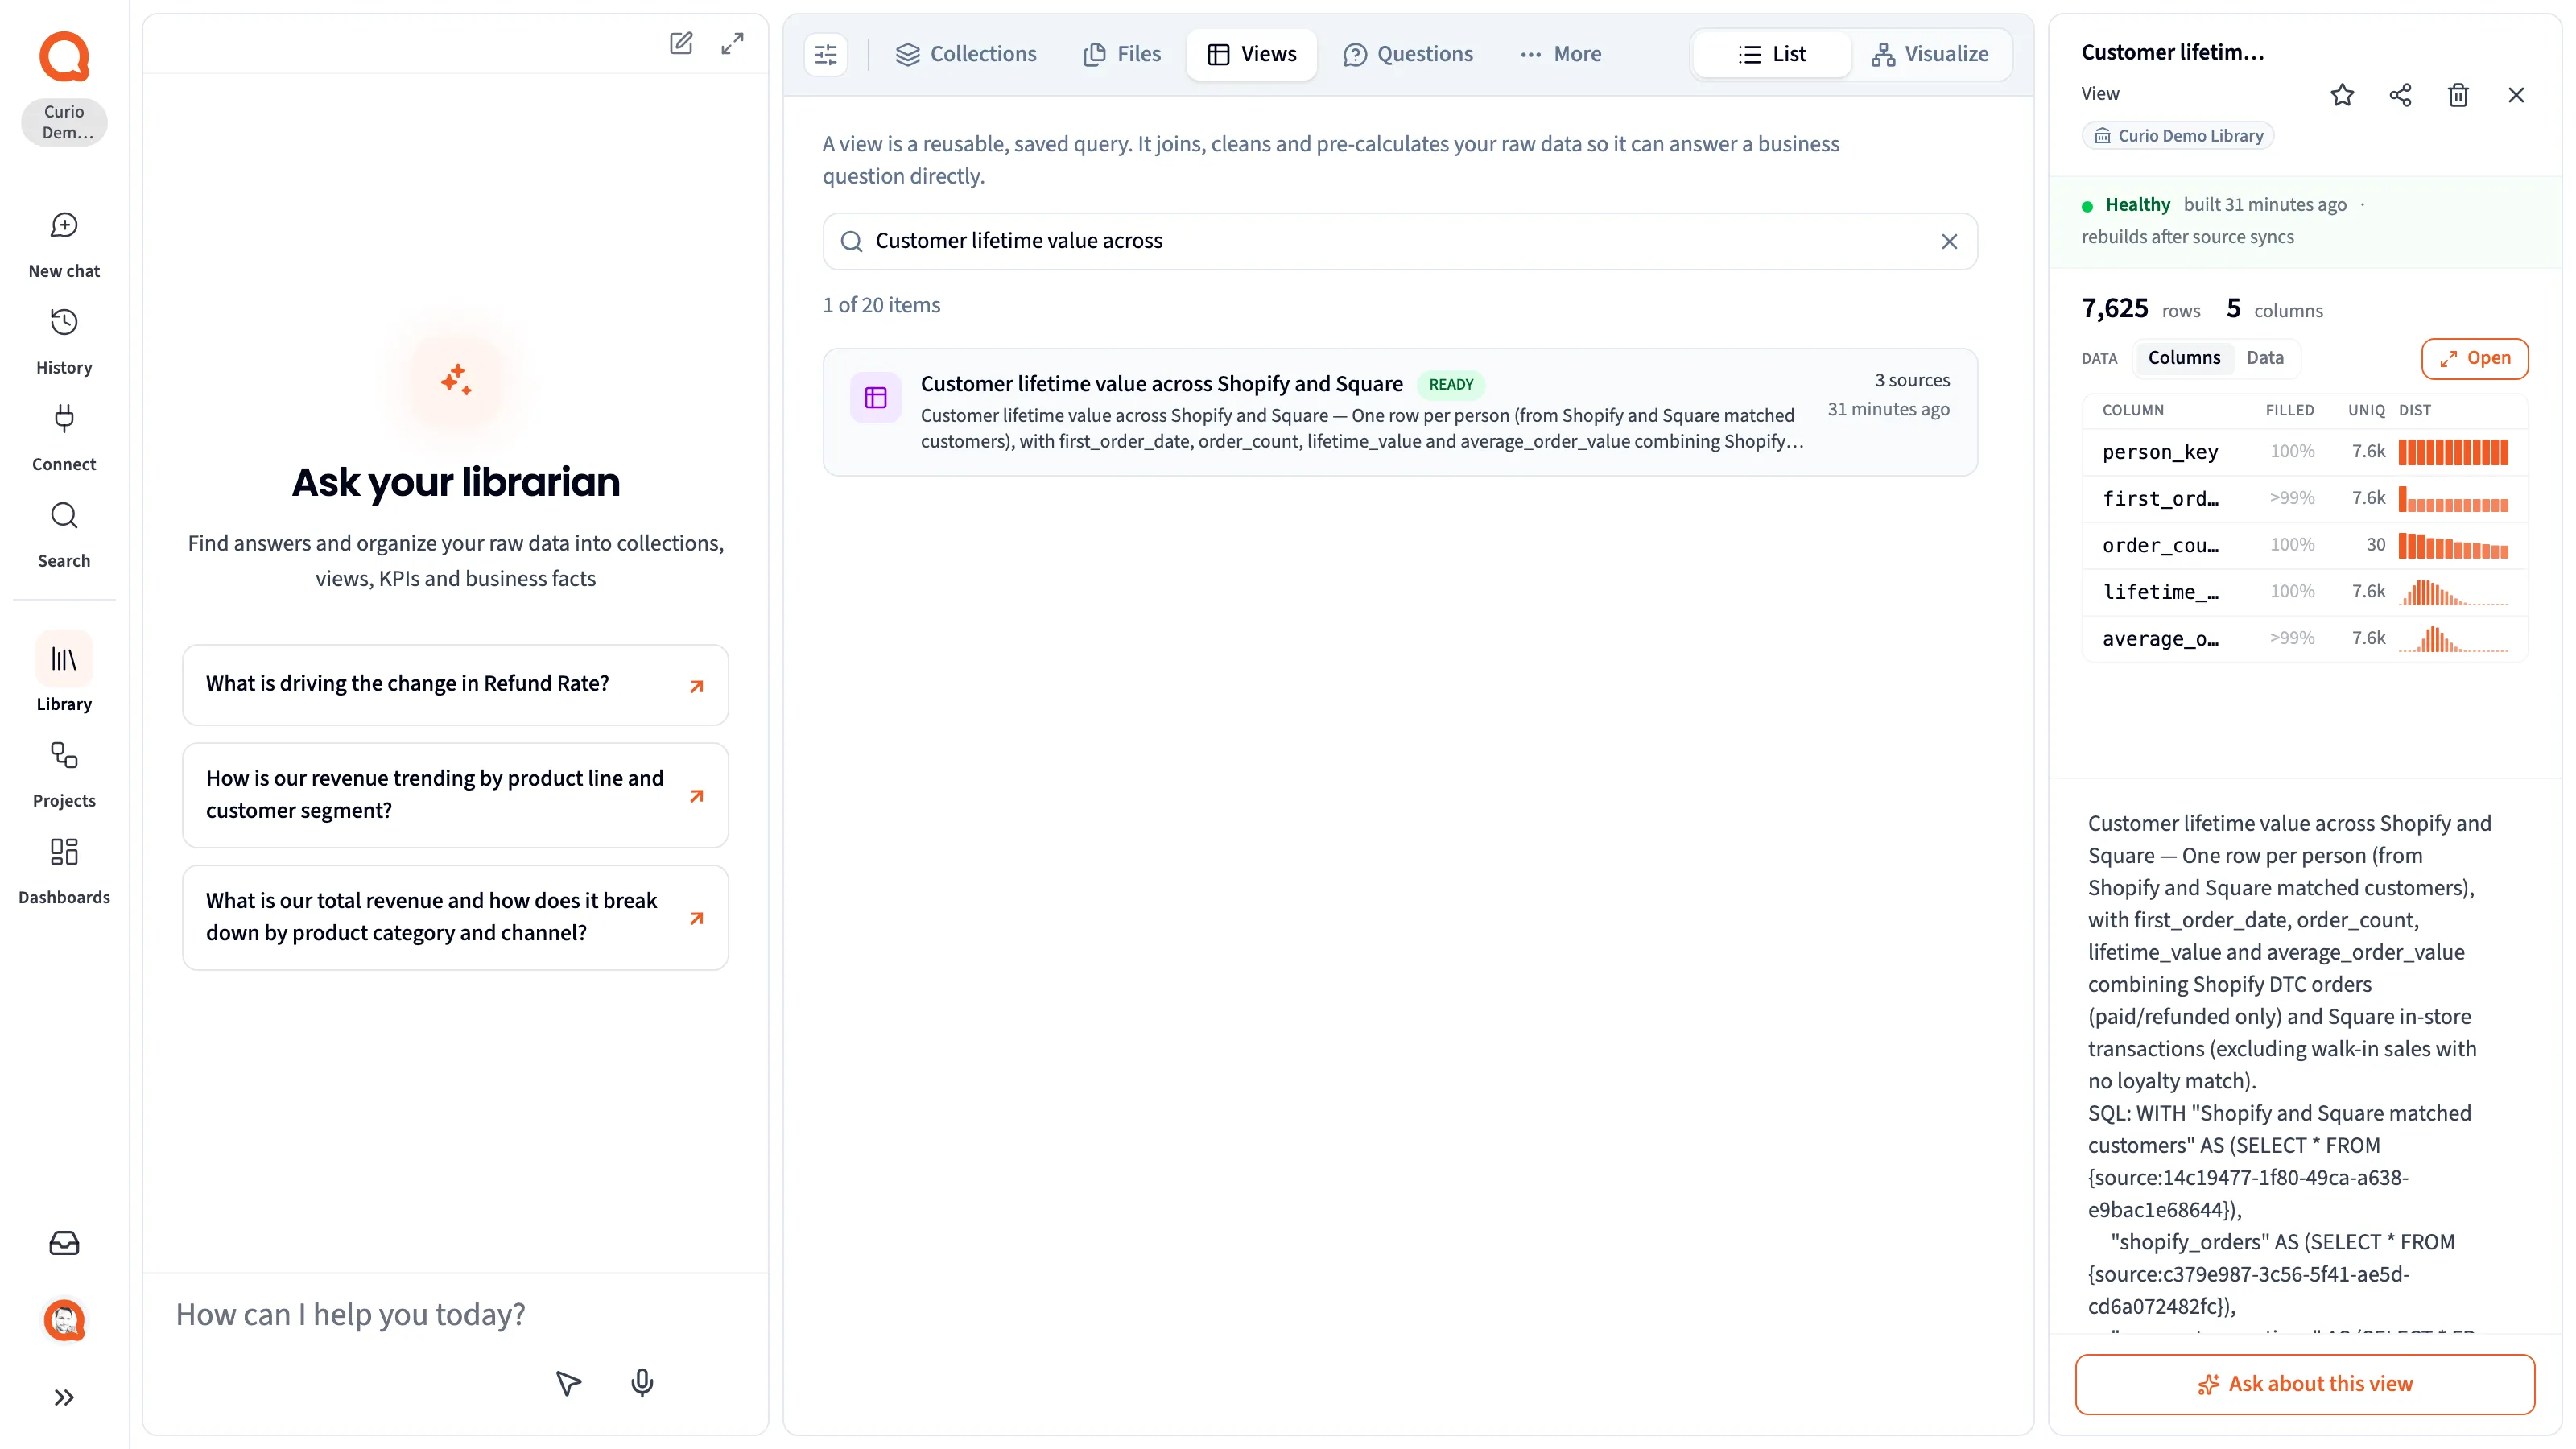
From the top:
- A status bar: Healthy once the view is built, with when it was built and “rebuilds after source syncs”. A view that isn’t ready shows its status on an amber bar.
- Data: the row and column counts, a Columns | Data switch, and Open for a full-screen table.
- Knowledge: the view’s description and Facts attached.
- Watching: any monitor on the view, and Monitor this to set one up. See Monitors.
- Connections: what the view is linked to, starting with Built from (the tables it reads), Answers (the questions it answers), Used by and Lives in.
- How it’s computed, folded: the view’s SQL. Long queries show the first 20 lines and a Show full SQL button.
A view that’s also a file in the workspace adds Location, Versions & replace and Activity at the bottom, and a Delete this view button in the header. Deleting a view is permanent. Its data, its definition and its place in the Library all go, and it doesn’t pass through Trash. A view something else depends on can’t be deleted, and the panel says what’s in the way: how many projects use it, each one linked so you can go and unpick it, and any views that read from it.
The Columns list
Section titled “The Columns list”Columns lists every column with its type and three quick checks:
| Heading | What it tells you |
|---|---|
| filled | The share of rows that have a value. It turns red below 90%. |
| uniq | How many distinct values there are. |
| dist | A small chart of how the values are spread. |
This is the place to spot-check a table and ask whether the data came in right. A column that’s mostly empty jumps out in red. Point at a column for a card with its distribution and its Populated, Missing and Unique values counts, plus Minimum and Maximum on a number column. Click a column’s name to open its own panel (see Columns).
Data swaps the list for a sample of the rows.
Source tables
Section titled “Source tables”A source is a raw table from a connector or an upload. Open one by clicking its name on the Files tab, or from a Built from chip on a view or a Measured from chip on a KPI.
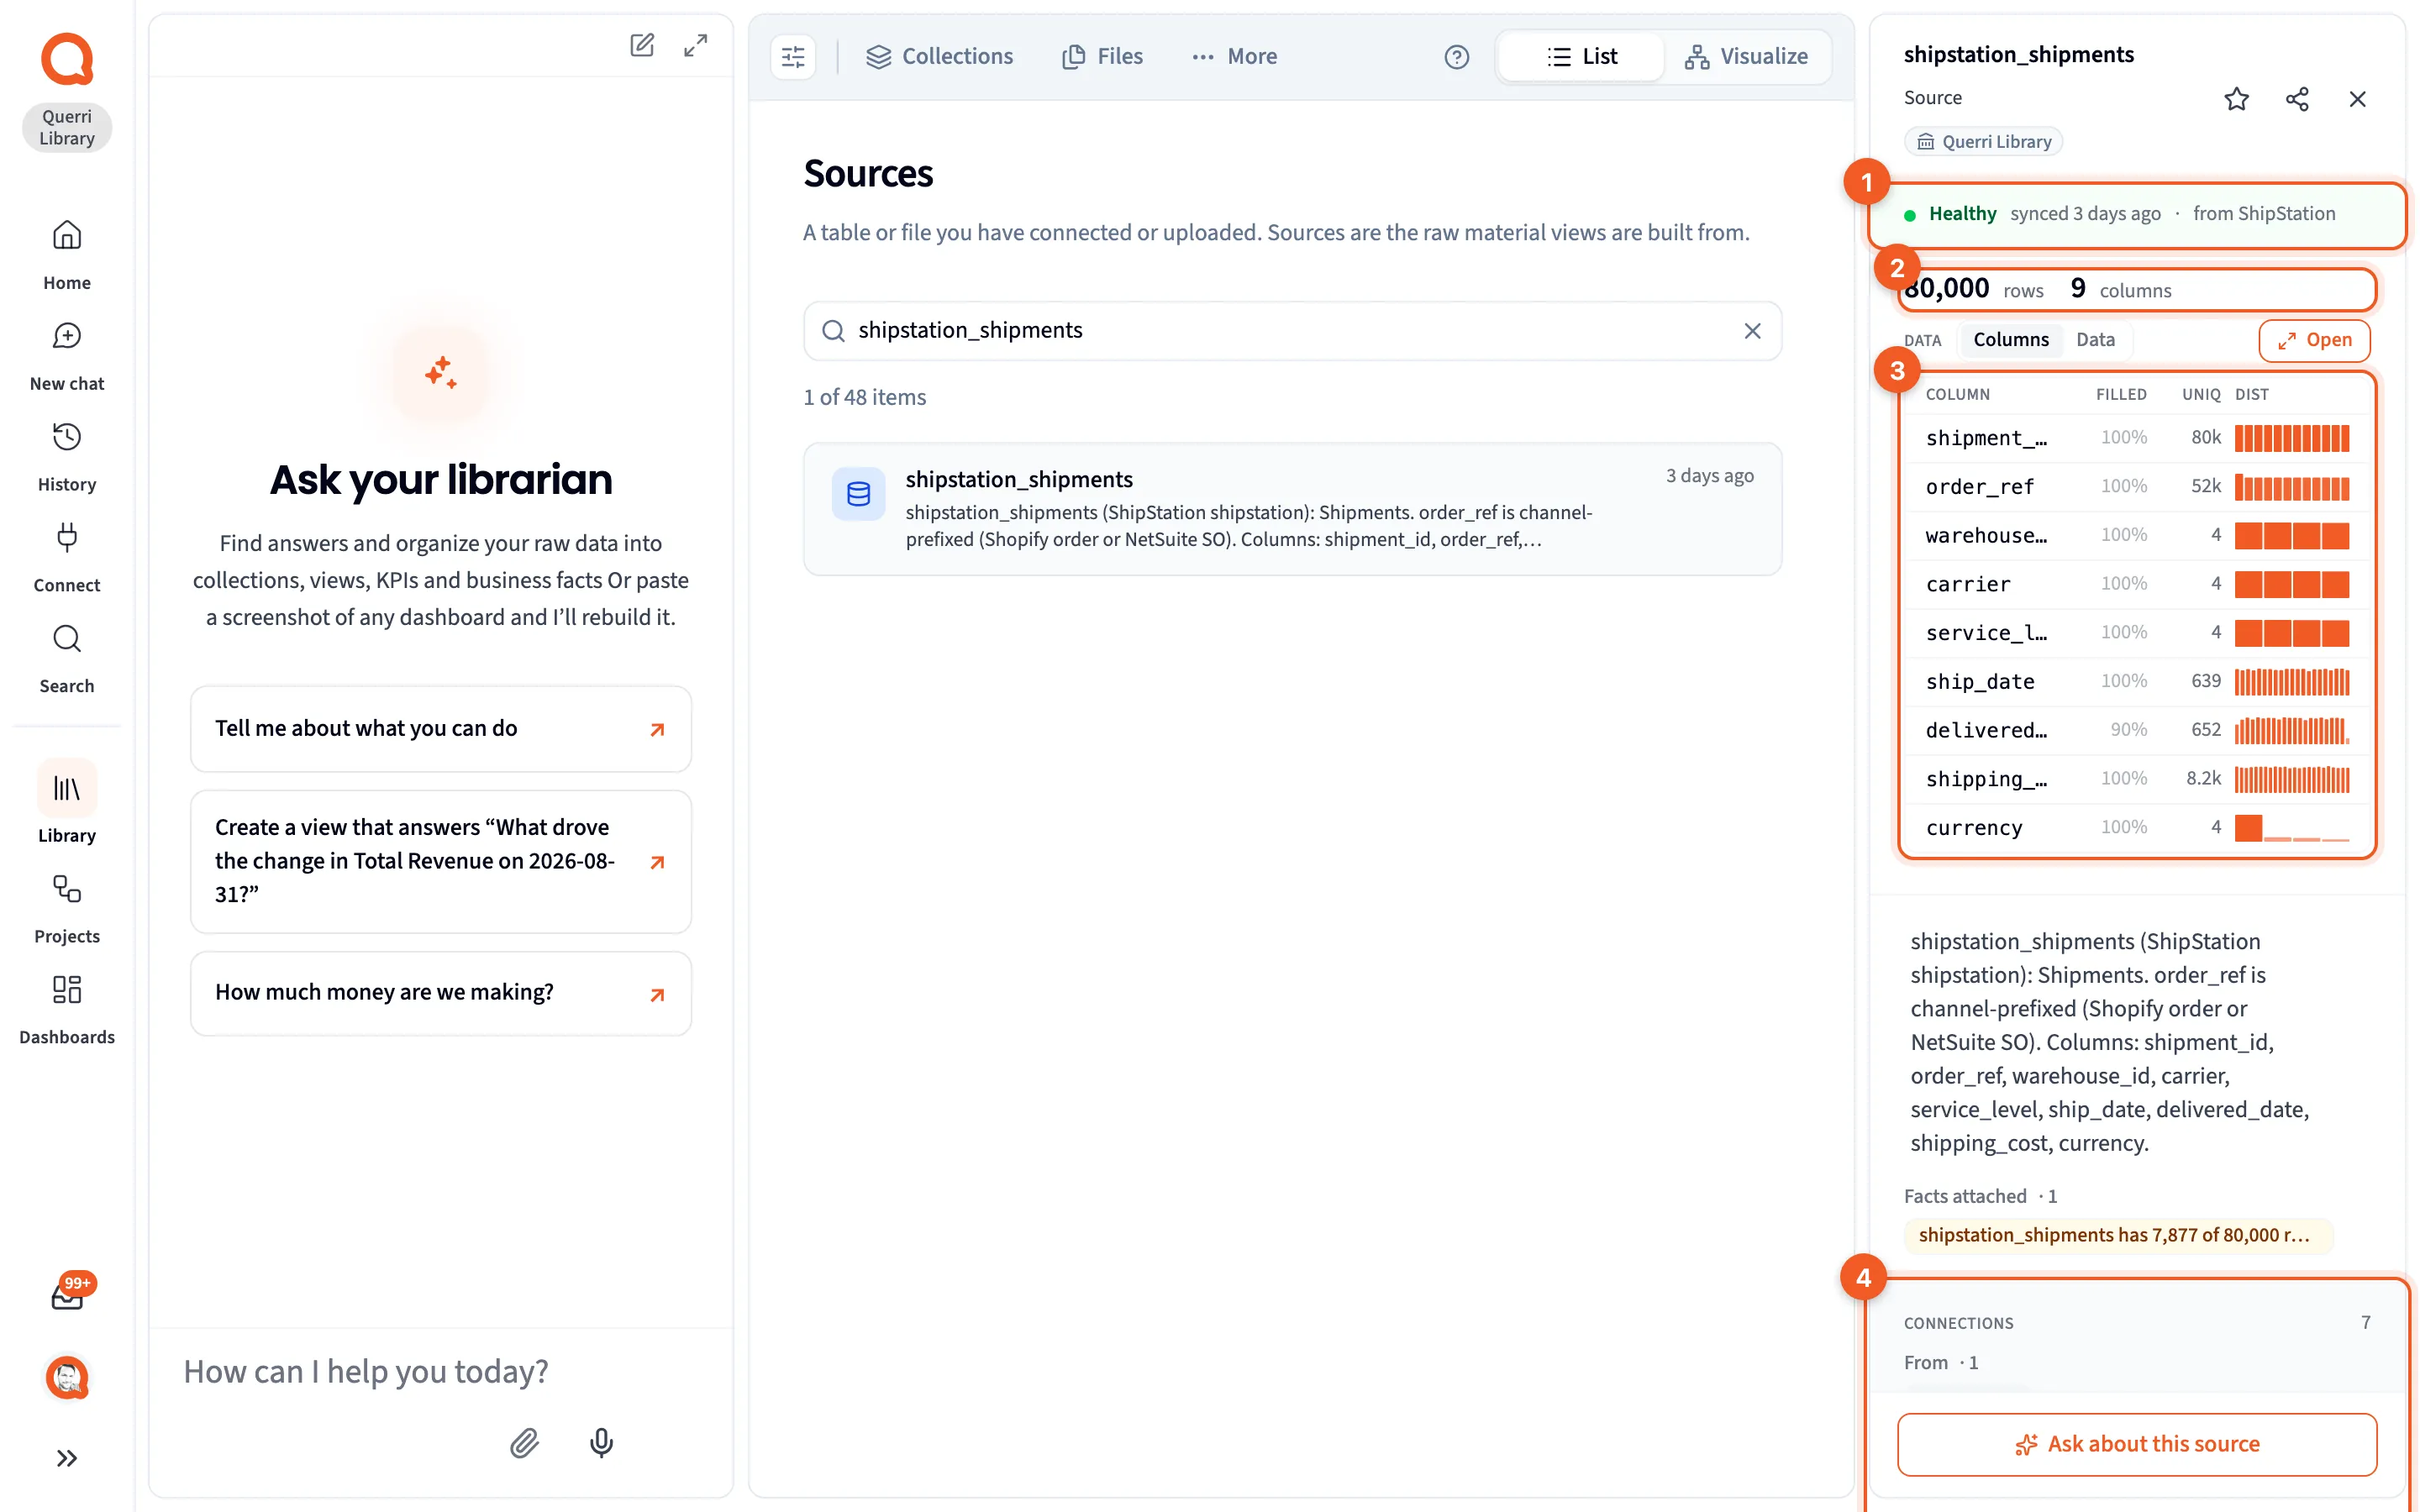
The badges mark the status bar (1), the row and column counts (2), the Columns list (3) and Connections (4).
From the top:
- A status bar: Healthy when it has synced, or Not synced yet. It says when it last synced and which connector it came from. A Restricted view pill means you can see only some of its rows.
- Data: row and column counts, the same Columns | Data switch and Open as a view, and the same filled, uniq and dist checks.
- Knowledge: the table’s description and Facts attached.
- Connections: From, Feeds, Used by and Lives in.
- How it’s made, folded: the connector it’s Synced from, or a note that it was uploaded directly.
- Access, folded: Full if you can read every row. Restricted means row-level security shows you a subset, while the numbers above still describe the whole table.
- Location, Versions & replace and Activity.
A source panel has no delete button and no Monitor this. You start monitors from views and KPIs, though a KPI measured from a source watches that source. See Sources and connectors.
Excel workbooks
Section titled “Excel workbooks”An uploaded workbook shows Excel workbook where the status would be. Instead of columns, it lists its Sheets, each with its size, and Open shows the workbook. To work with a sheet, ask the Librarian to build a view from it. That turns the sheet into a real table you can query, chart and monitor.
Columns
Section titled “Columns”Click a column’s name in a view’s or a source’s Columns list. The header shows the table and column names together, and calls the column a series, so the footer button reads Ask about this series.
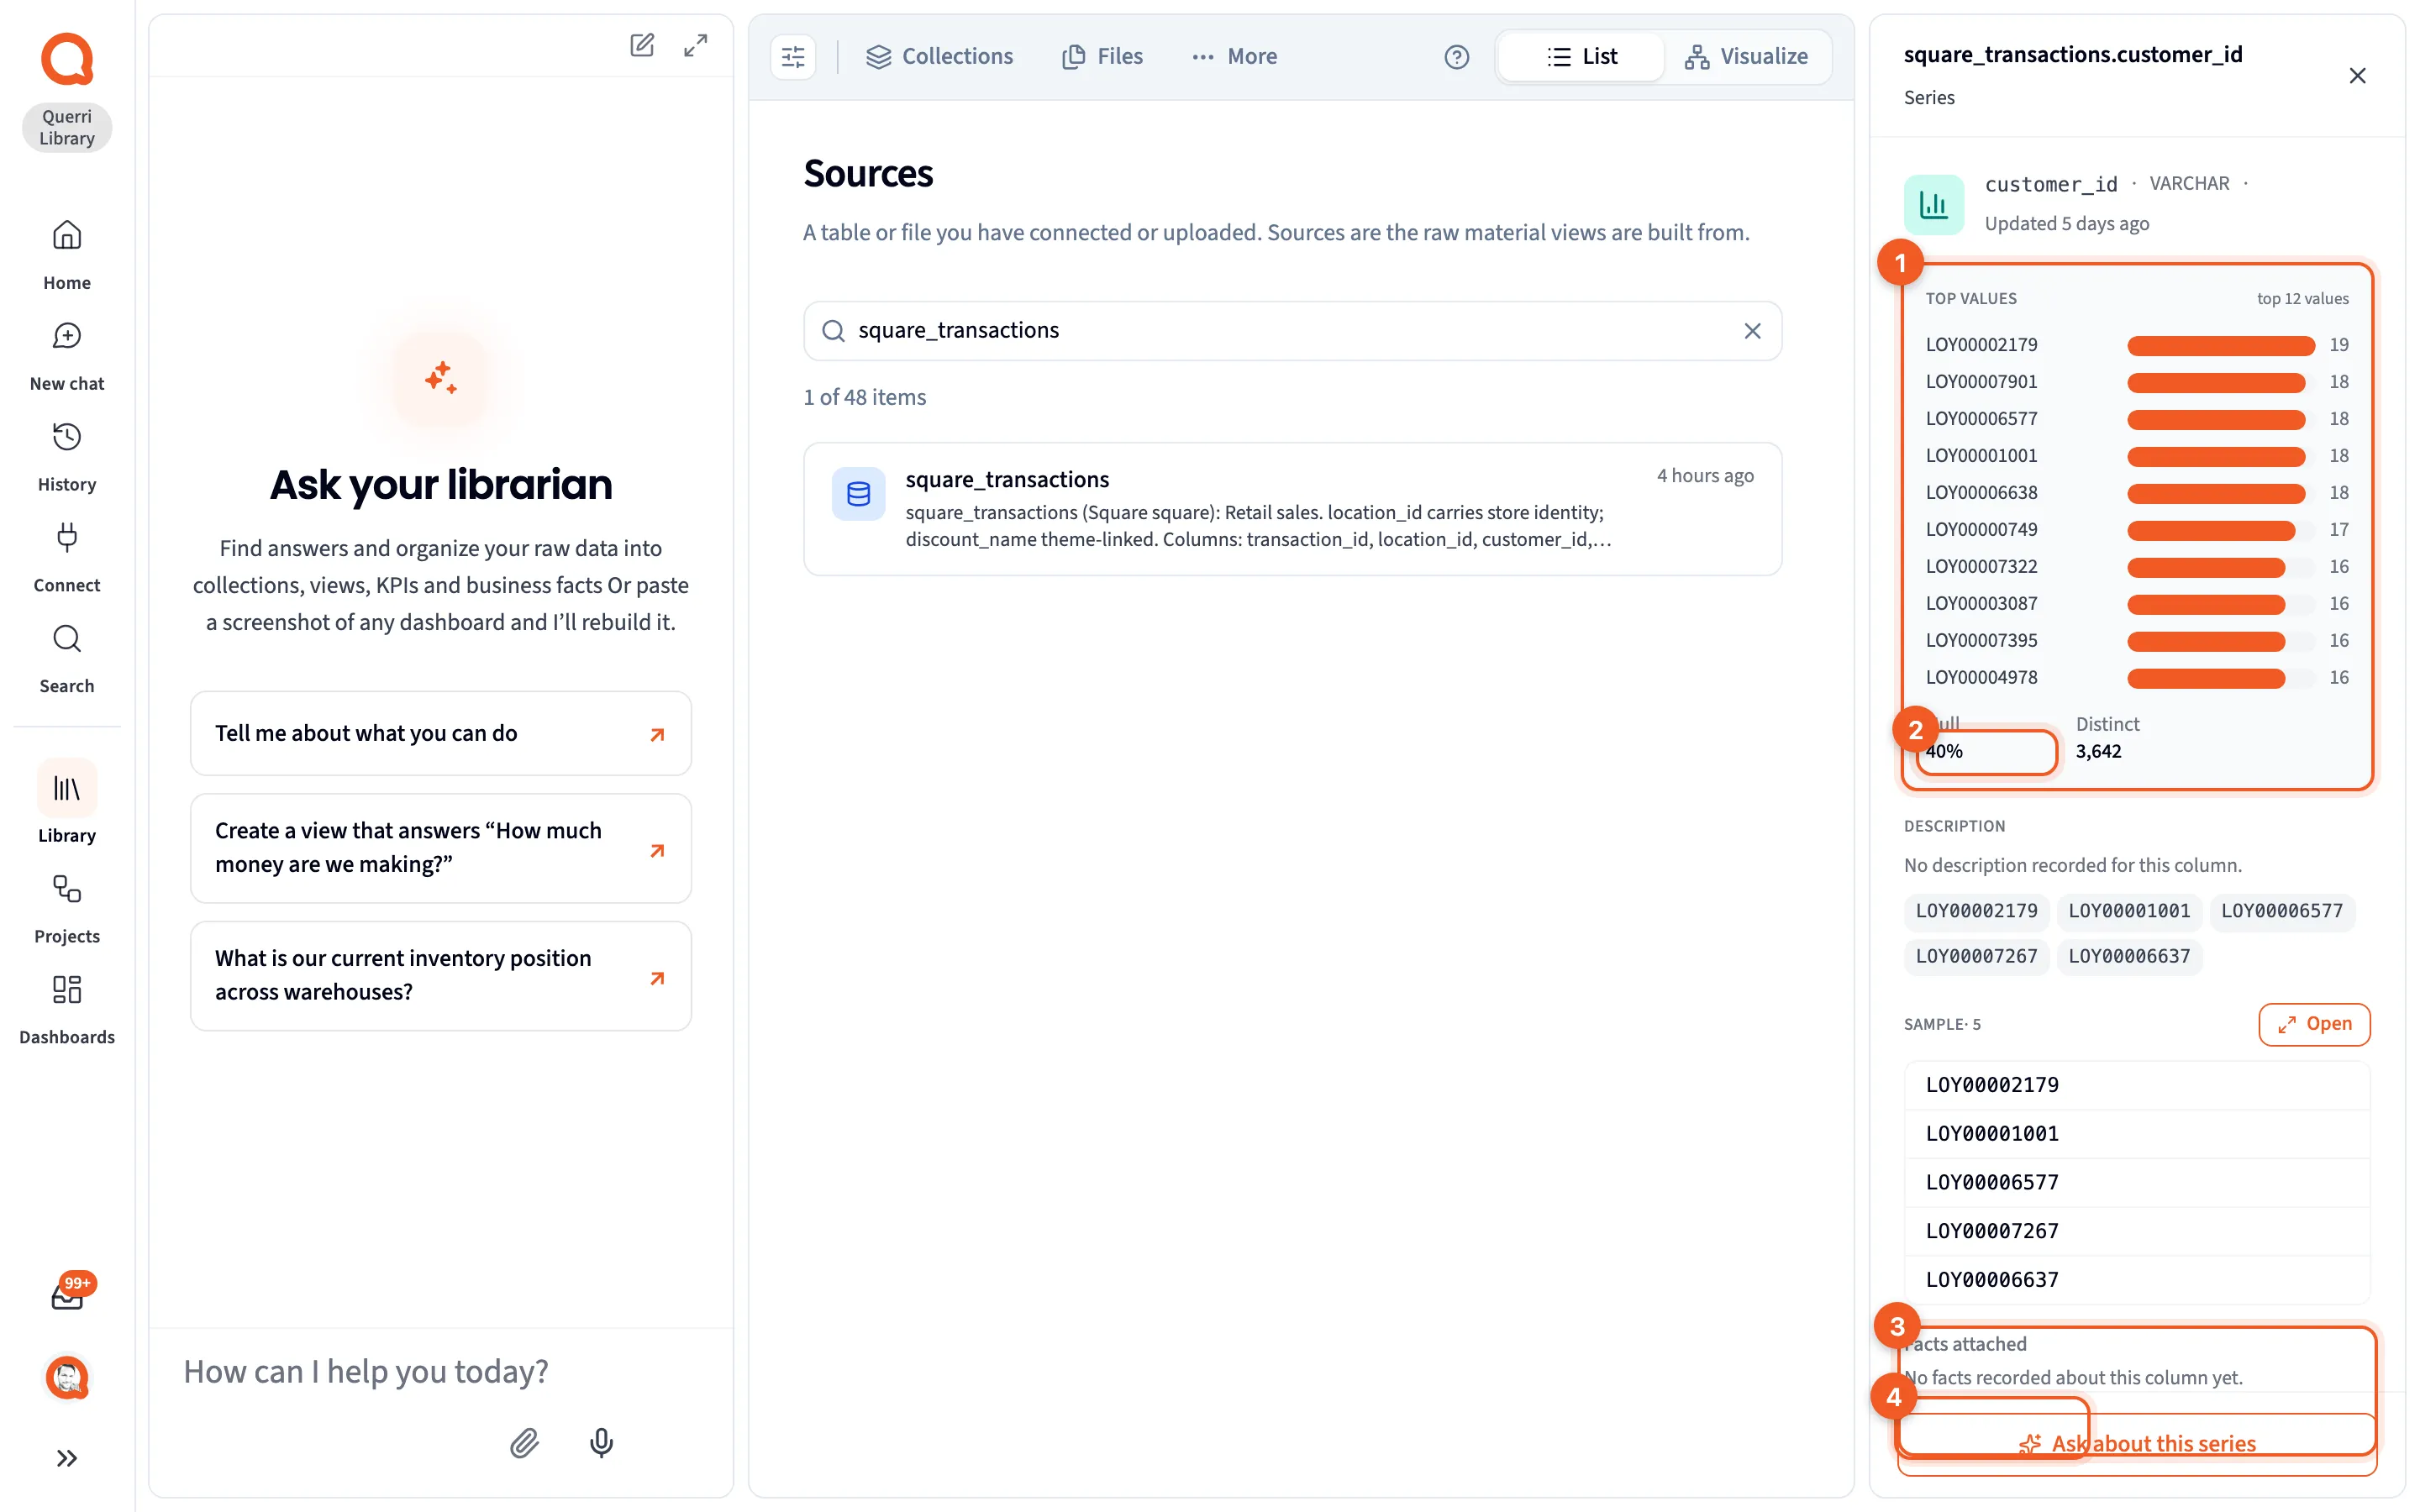
The badges mark the chart of top values (1), Null (2), Facts attached (3) and the footer Ask about this series button (4).
From the top:
- The column’s name, its type, and when it was updated.
- A chart and statistics. Numbers get Distribution, dates get Rows over time, and text gets Top values, which counts the rows behind each value and labels an empty one (blank). Under the chart are Null (the share of empty rows) and Distinct, and number columns add Min, Mean, Median and Max.
- The column’s description, if one was recorded, and some sample values.
- Sample: more sample values, and Open for the whole table.
- Facts: Facts attached, and the Attach a fact button.
- In source, folded: the table the column belongs to.
Attach a fact
Section titled “Attach a fact”This is the only place where you write a fact by hand. Use it for anything someone should know before trusting a column: a rule, a definition, or something you’ve noticed about the data.
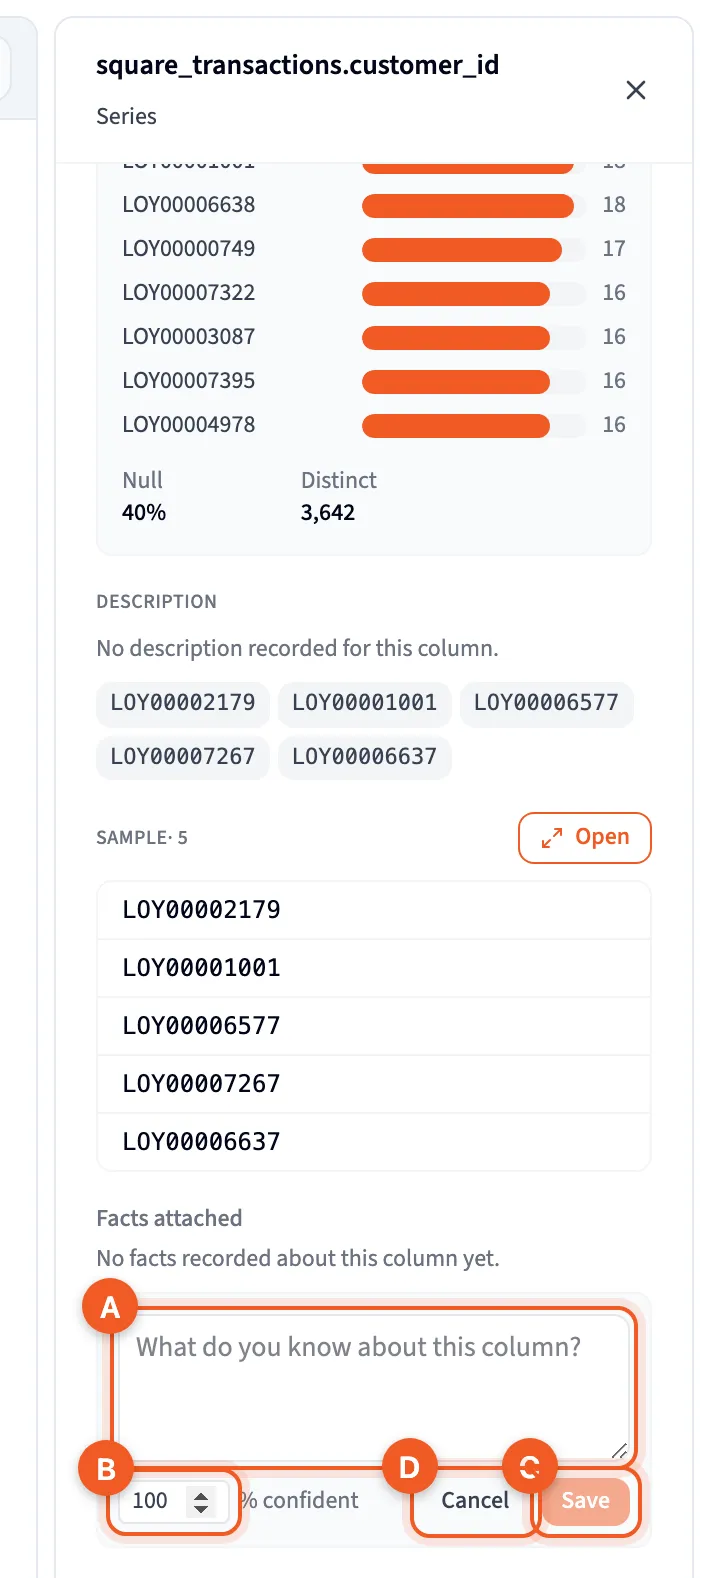
- Open the column’s panel.
- Click Attach a fact.
- Type the fact where it asks “What do you know about this column?” (A)
- Set how sure you are in the % confident box (B). It starts at 100.
- Click Save (C), or Cancel (D) to throw the draft away. Save stays dimmed until you type something.
The fact shows up under Facts attached right away, marked “Saving…” until it’s stored. If it can’t be saved, your text comes back so you don’t lose it, with the message “Couldn’t attach the fact”.
A fact you attach is saved as a note. To make it a data quality, timing or scope fact, open it and change its kind (see Facts).