
Knowledge tabs
Five of the Library’s tabs list what Querri knows about your business rather than your files: collections, questions, views, KPIs and facts.
Who can see this: everyone with access to the workspace. Each list shows only the items you’re allowed to see.
What every tab has
Section titled “What every tab has”Apart from Collections, each tab opens with a one-line description of what’s in it. Under that you’ll find a search box, a count, and the list, with the most recently updated items first.
- Type in the search box to filter the list. The count changes to “N of M items” while you search.
- Click a row to open its detail panel on the right.
- New items show up on their own. If the Librarian records a fact while you’re chatting, it appears without a reload.
You won’t find a create button on any of these tabs. The Librarian adds collections, questions, views, KPIs and facts as you work with it, and some also come from onboarding or from accepting Inbox cards. Facts are the one thing you can write yourself, with Attach a fact on a column (see Attach a fact).
You can also open these lists from the Knowledge group in the browse panel.
Collections
Section titled “Collections”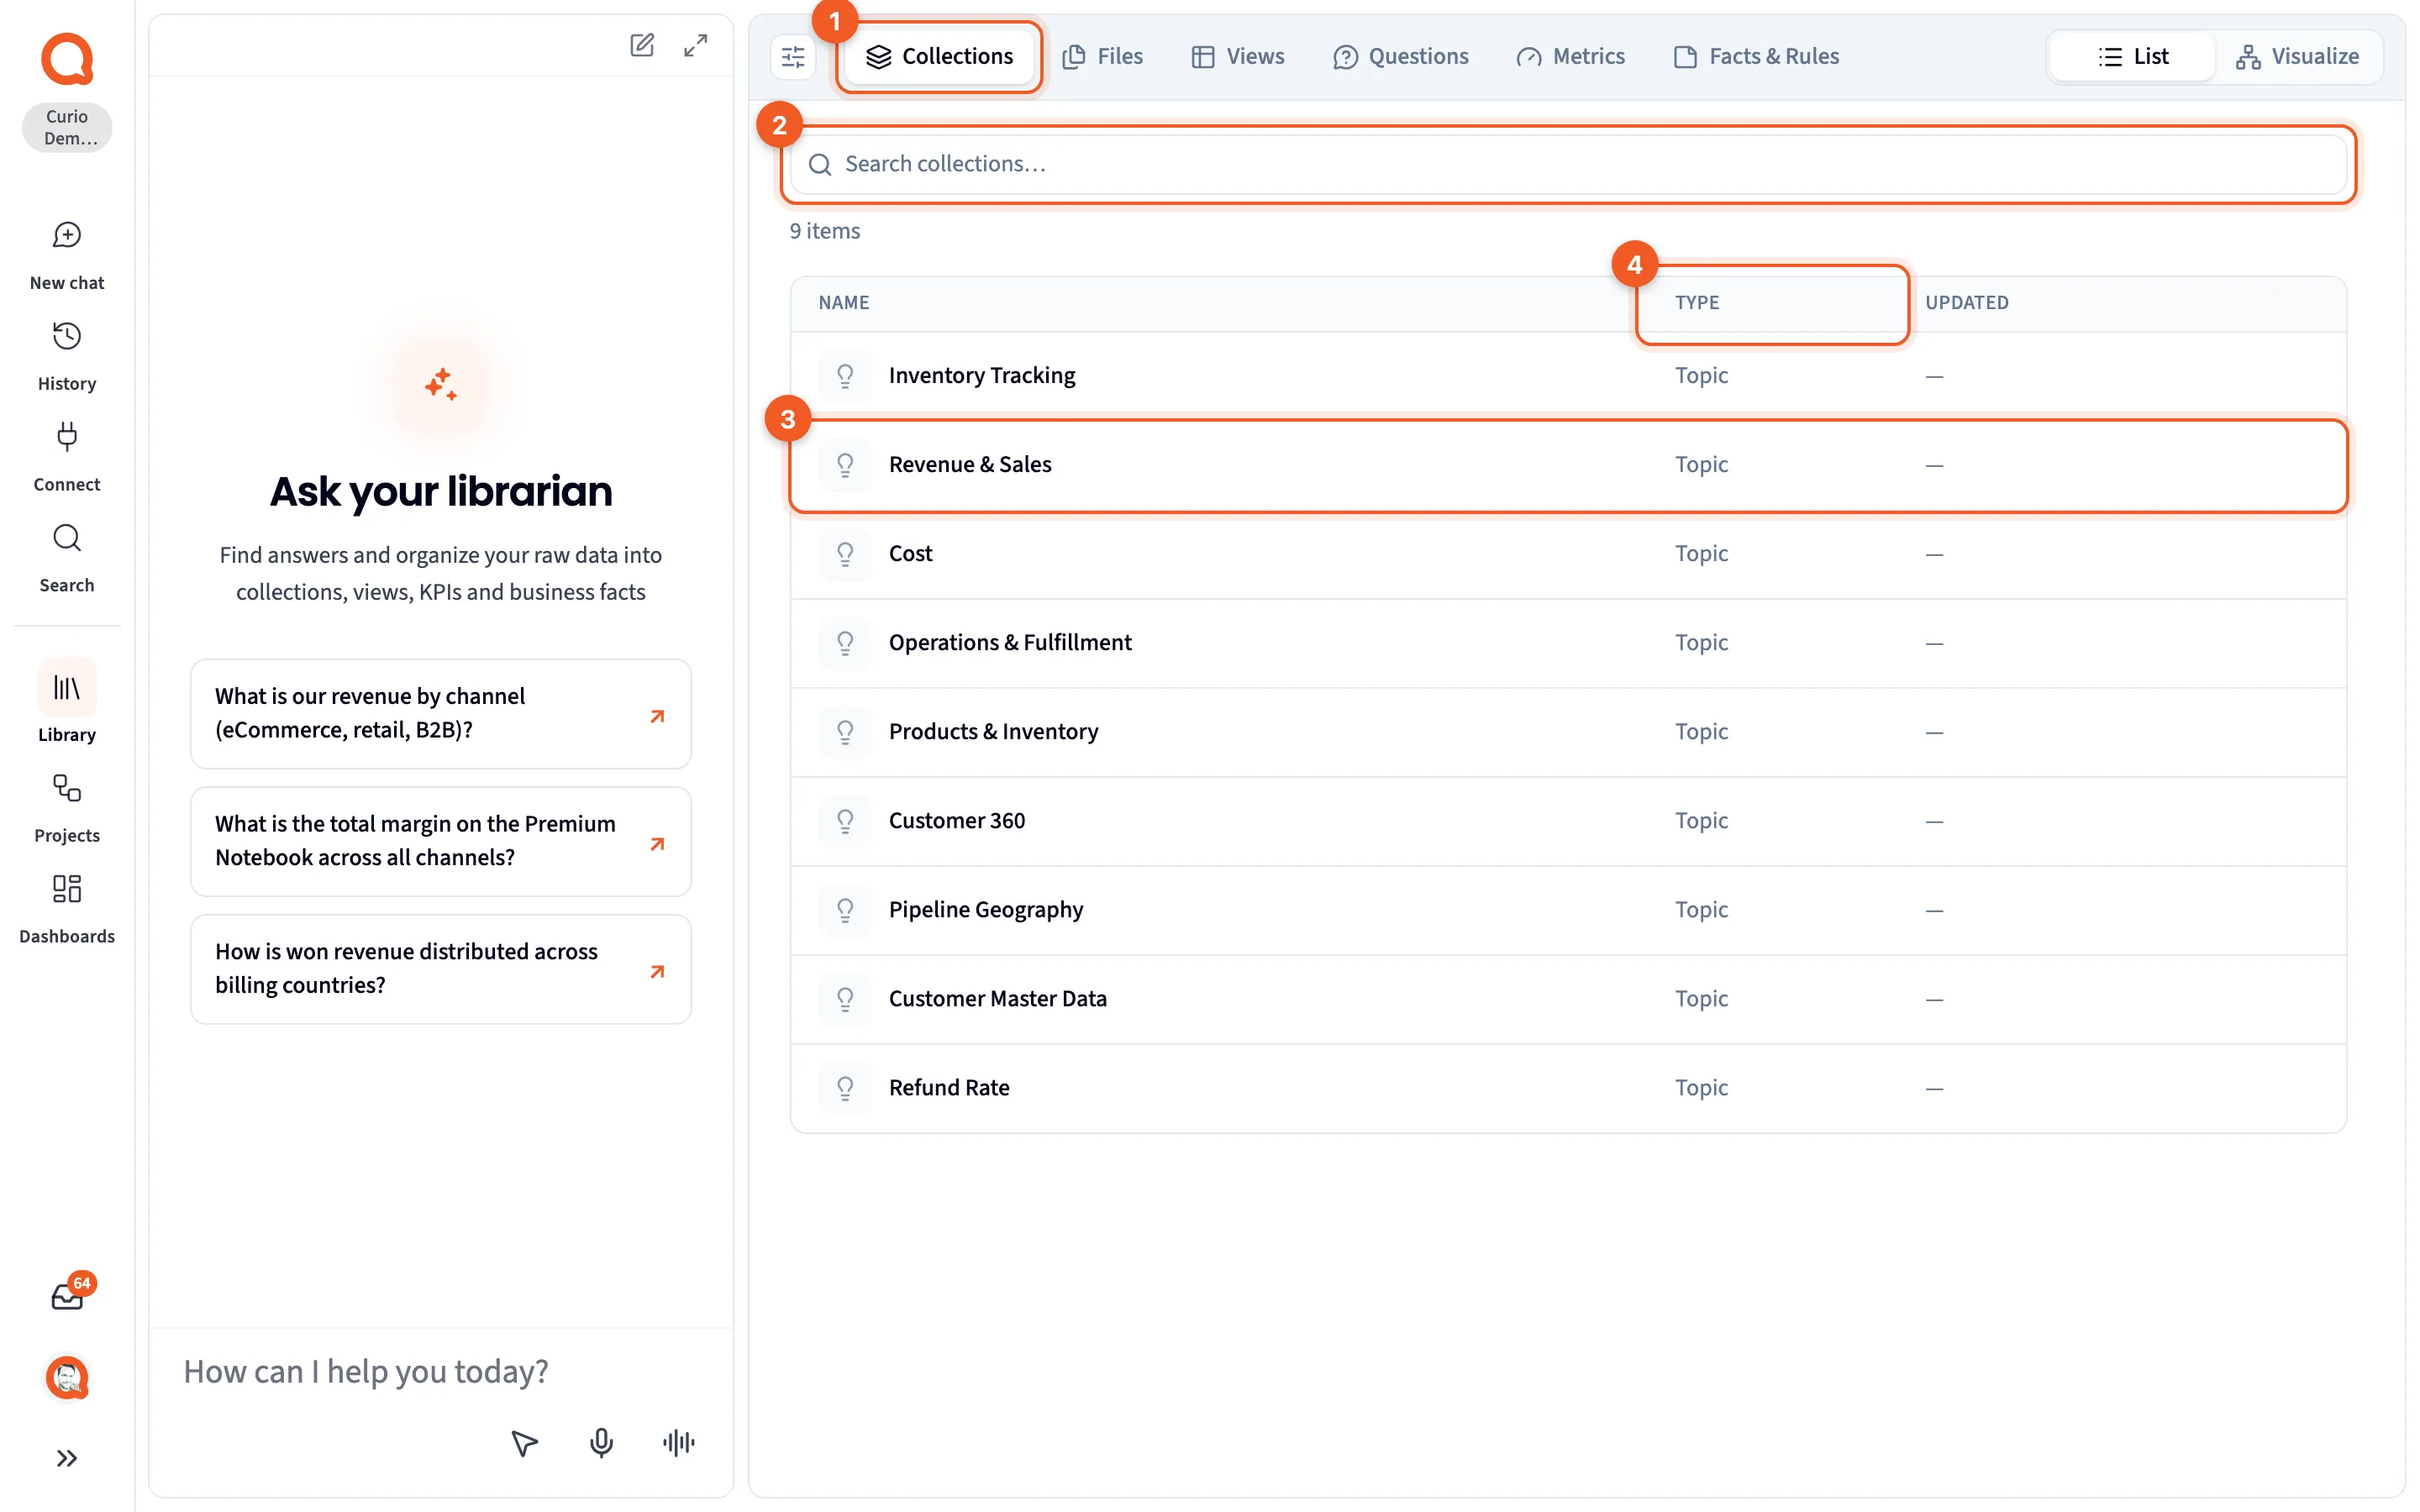
- Collections: the tab.
- Search collections…: filter the list.
- A collection: click it to open its collection page.
- TYPE: every collection here reads Topic.
A collection is one business subject. It holds a main question, the questions that break it down, the views that answer them, and the facts recorded along the way. Its page is described in Detail panels. See Collections.
Questions
Section titled “Questions”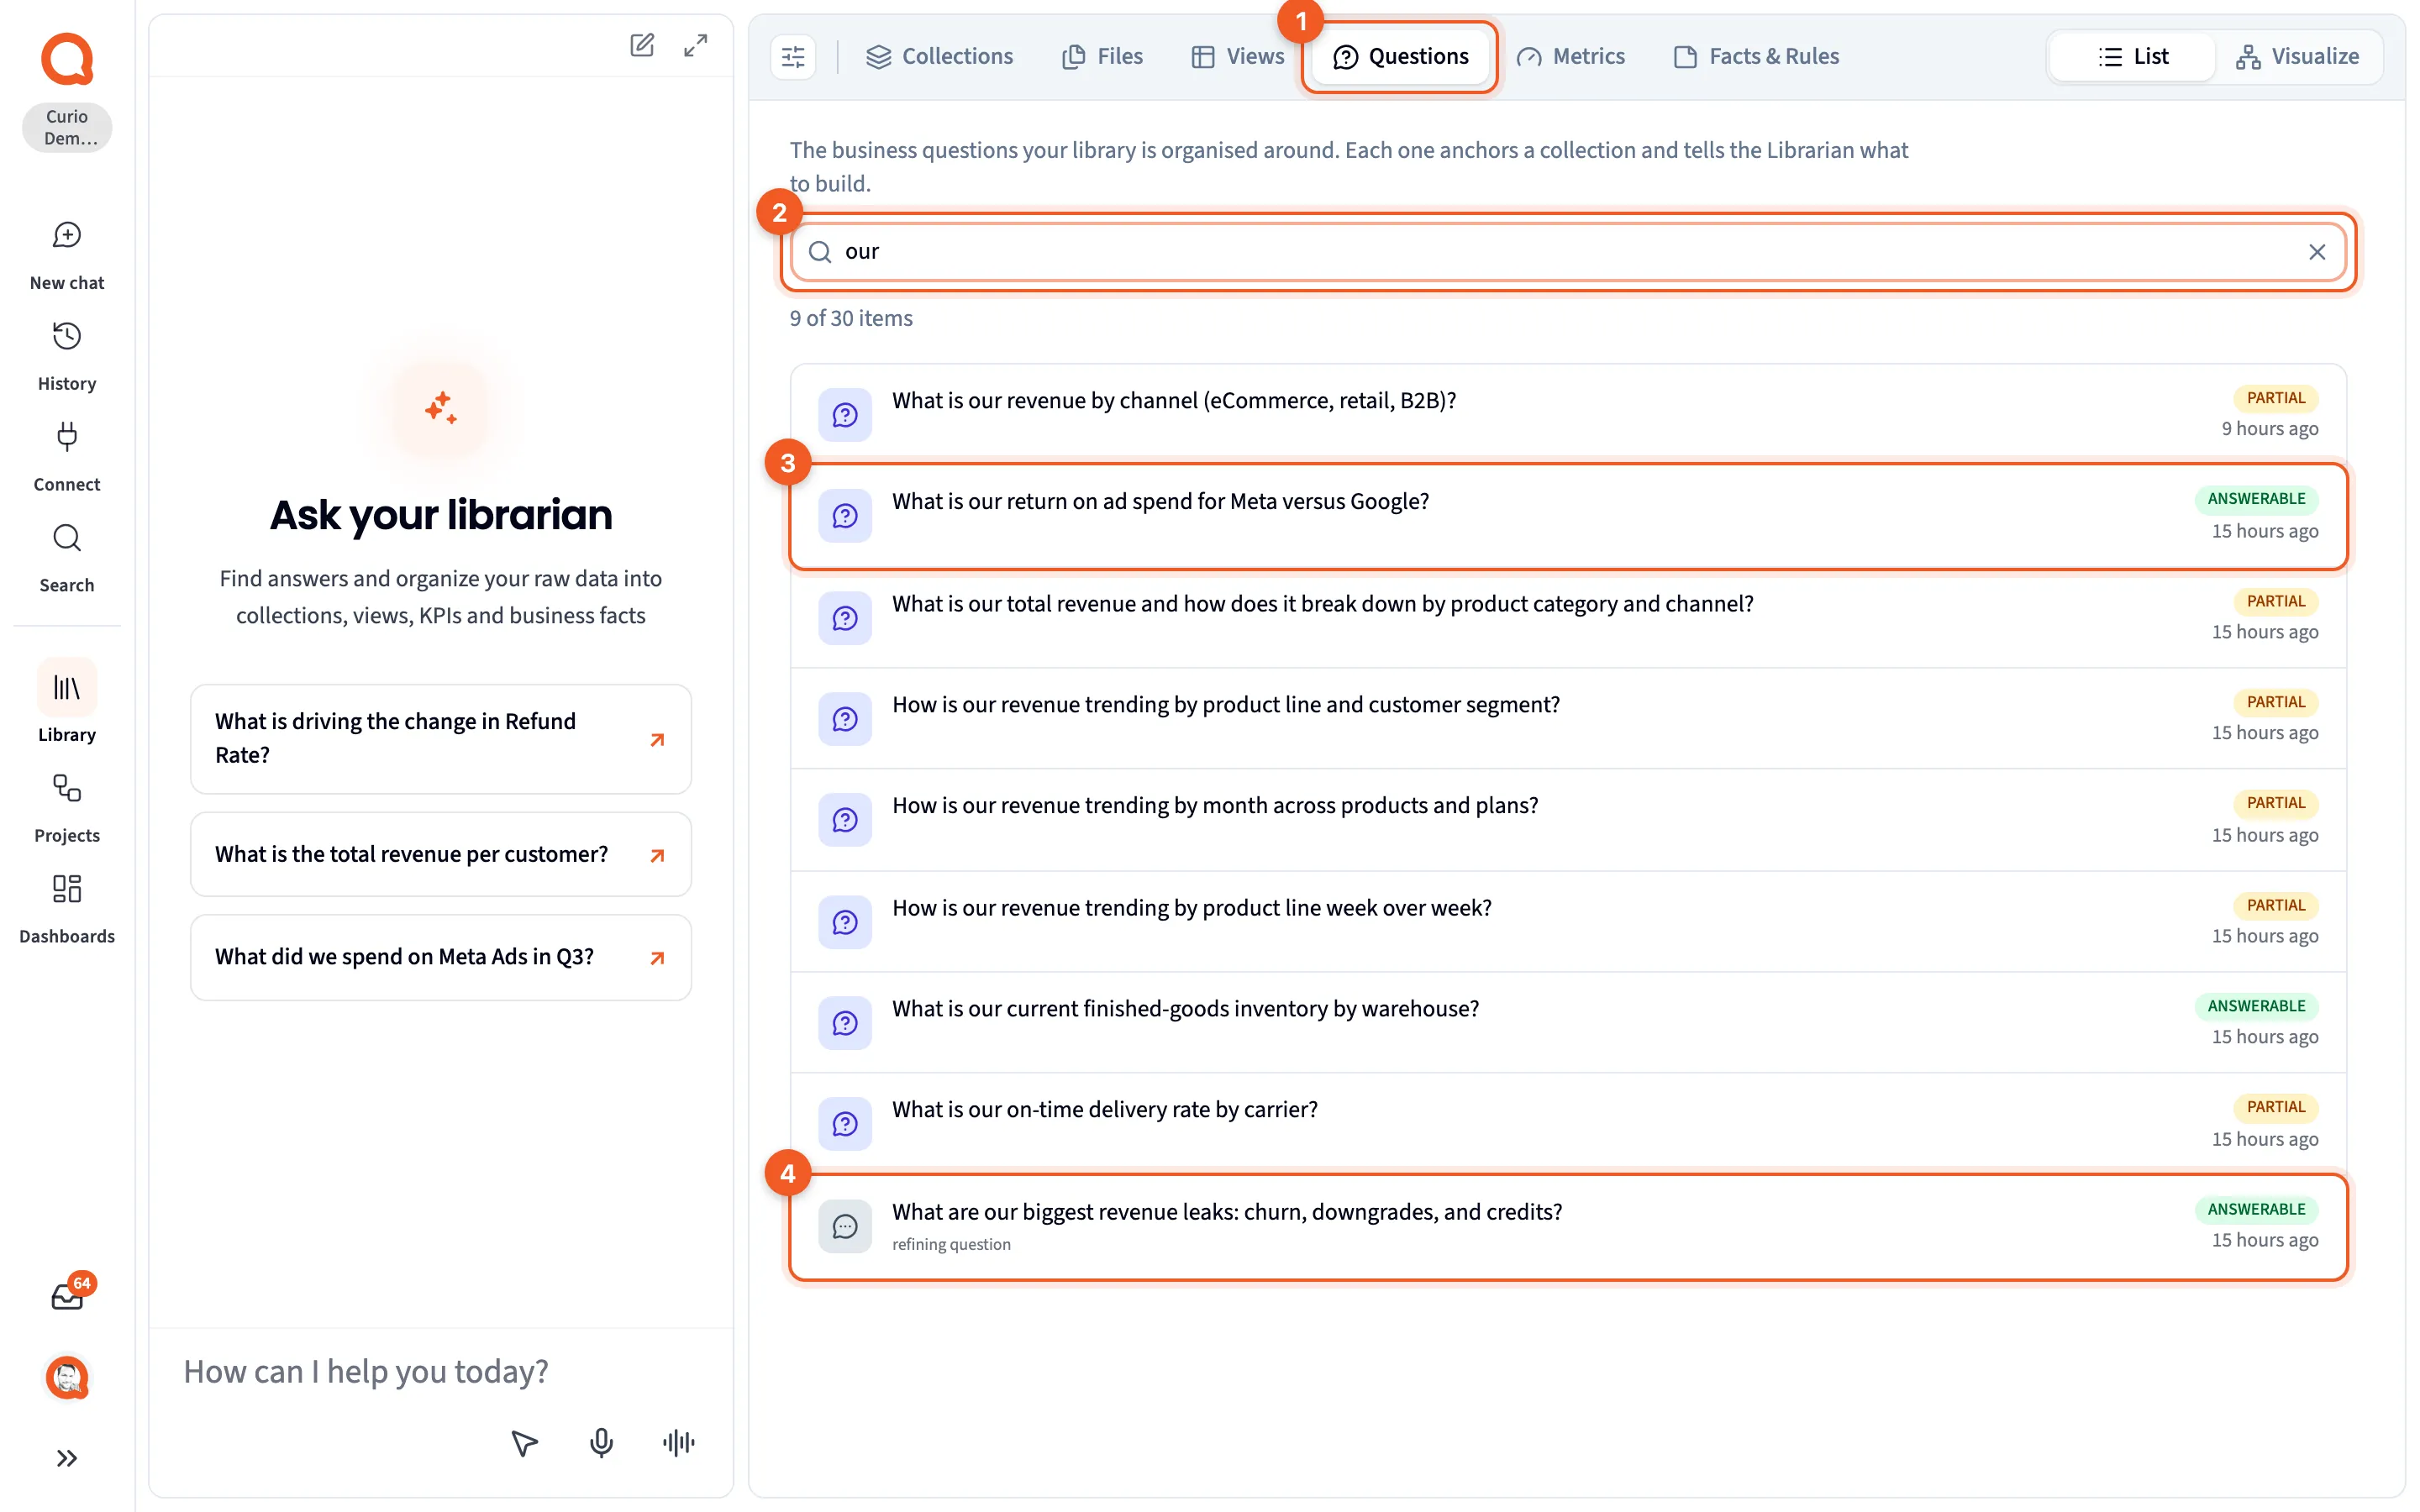
- Questions: the tab.
- The search box, here filtered to “our”.
- An anchor question: the main question a collection is built around.
- A refining question: a narrower question that drills into an anchor. The words “refining question” appear under it.
Everything in the Library is organized around questions. In the tab’s own words, “Each one anchors a collection and tells the Librarian what to build.”
A badge on the right says whether your data can answer the question.
| Badge | Meaning |
|---|---|
| ANSWERABLE | The question is linked to real sources, so the data is there. |
| PARTIAL | Some of the data is there. An answer may be incomplete. |
| UNANSWERABLE | The data isn’t there. Connect a source or refine the question first. |
| No badge | Not checked yet. The Librarian works it out as it answers. |
This badge is about data, not views. A question can be ANSWERABLE with no view built for it yet. The collection page uses different words (Answered, Answerable and No view yet) to say whether a view answers a question, so the same word means two different things in the two places. See Start with questions, not tables and Anchor and refining questions.
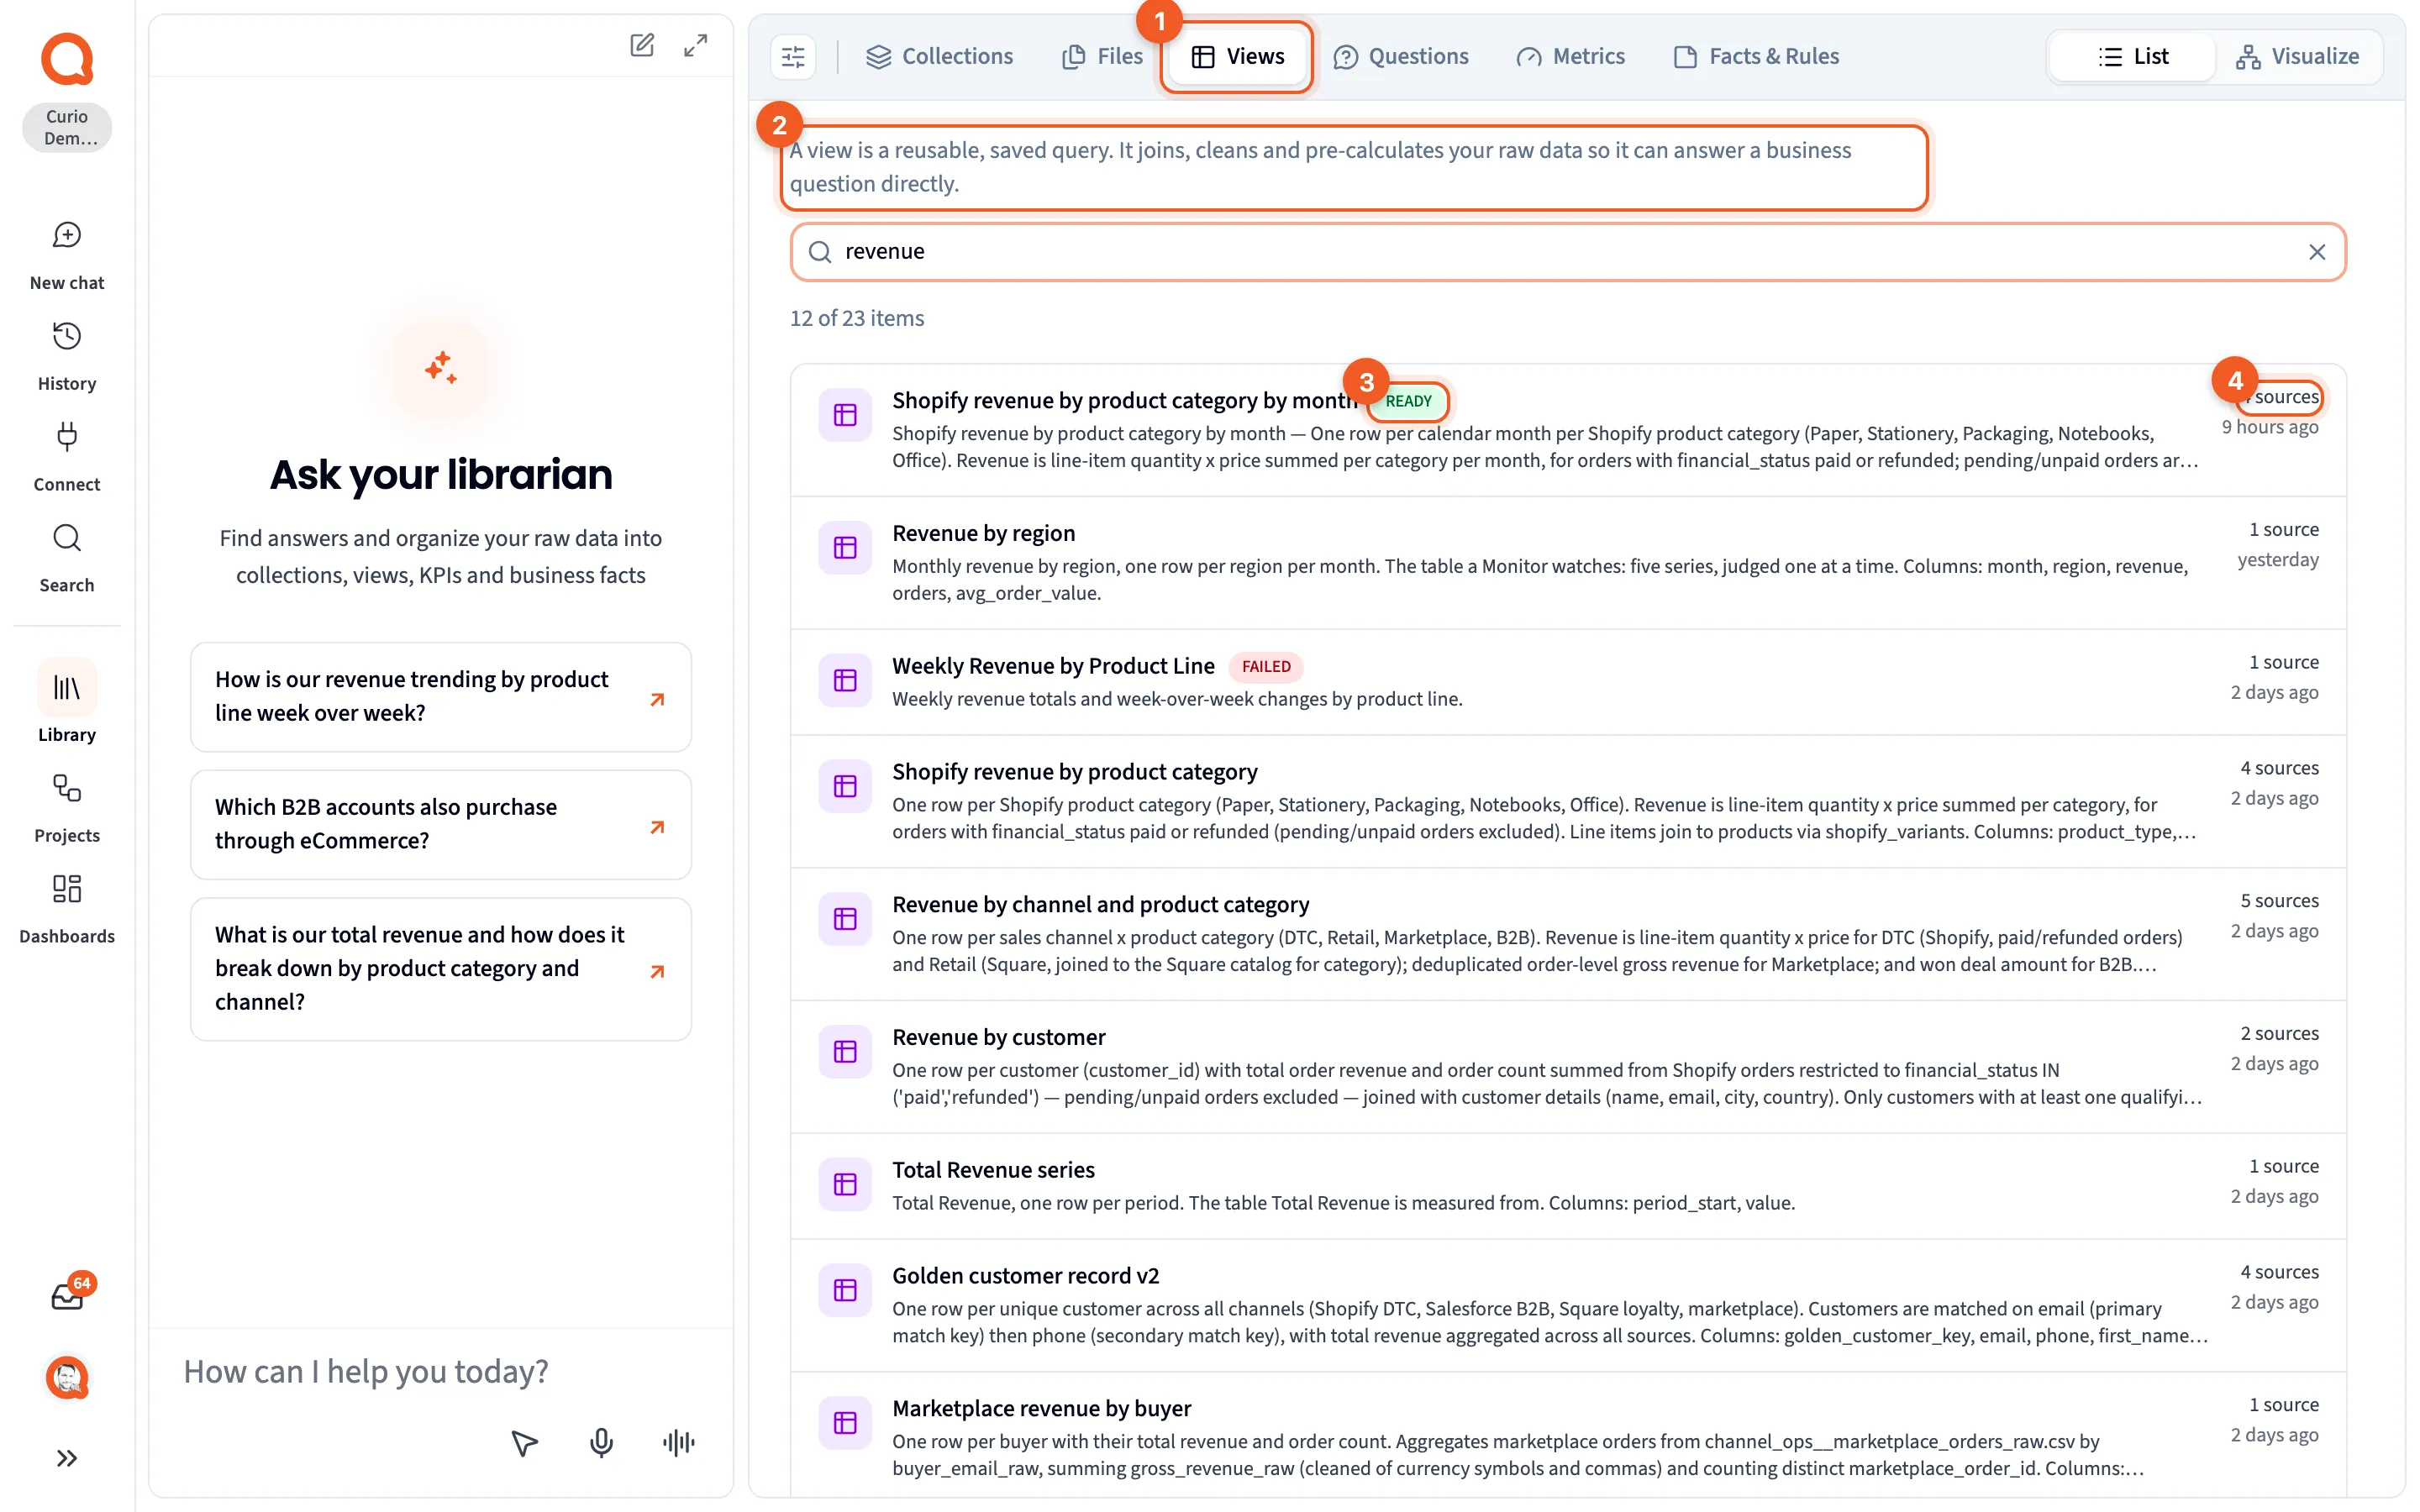
- Views: the tab.
- The description: “A view is a reusable, saved query. It joins, cleans and pre-calculates your raw data so it can answer a business question directly.”
- READY: the view’s status.
- Source count: how many sources the view is built from.
A view does the joining and cleaning once, ahead of time, so questions that use it don’t start again from the raw tables. Views rebuild on their own after their sources sync. See Views.
Each row shows the view’s name, its status, a summary and when it last changed. The status badge is one of these:
- READY or MATERIALIZED (green): built and ready to use.
- COMMISSIONING or PROPOSED (yellow): not built yet.
- FAILED (red): the build didn’t work.
Metrics
Section titled “Metrics”Your KPIs are listed under the Metrics tab. Their detail panels, and the rest of Querri, call them KPIs.
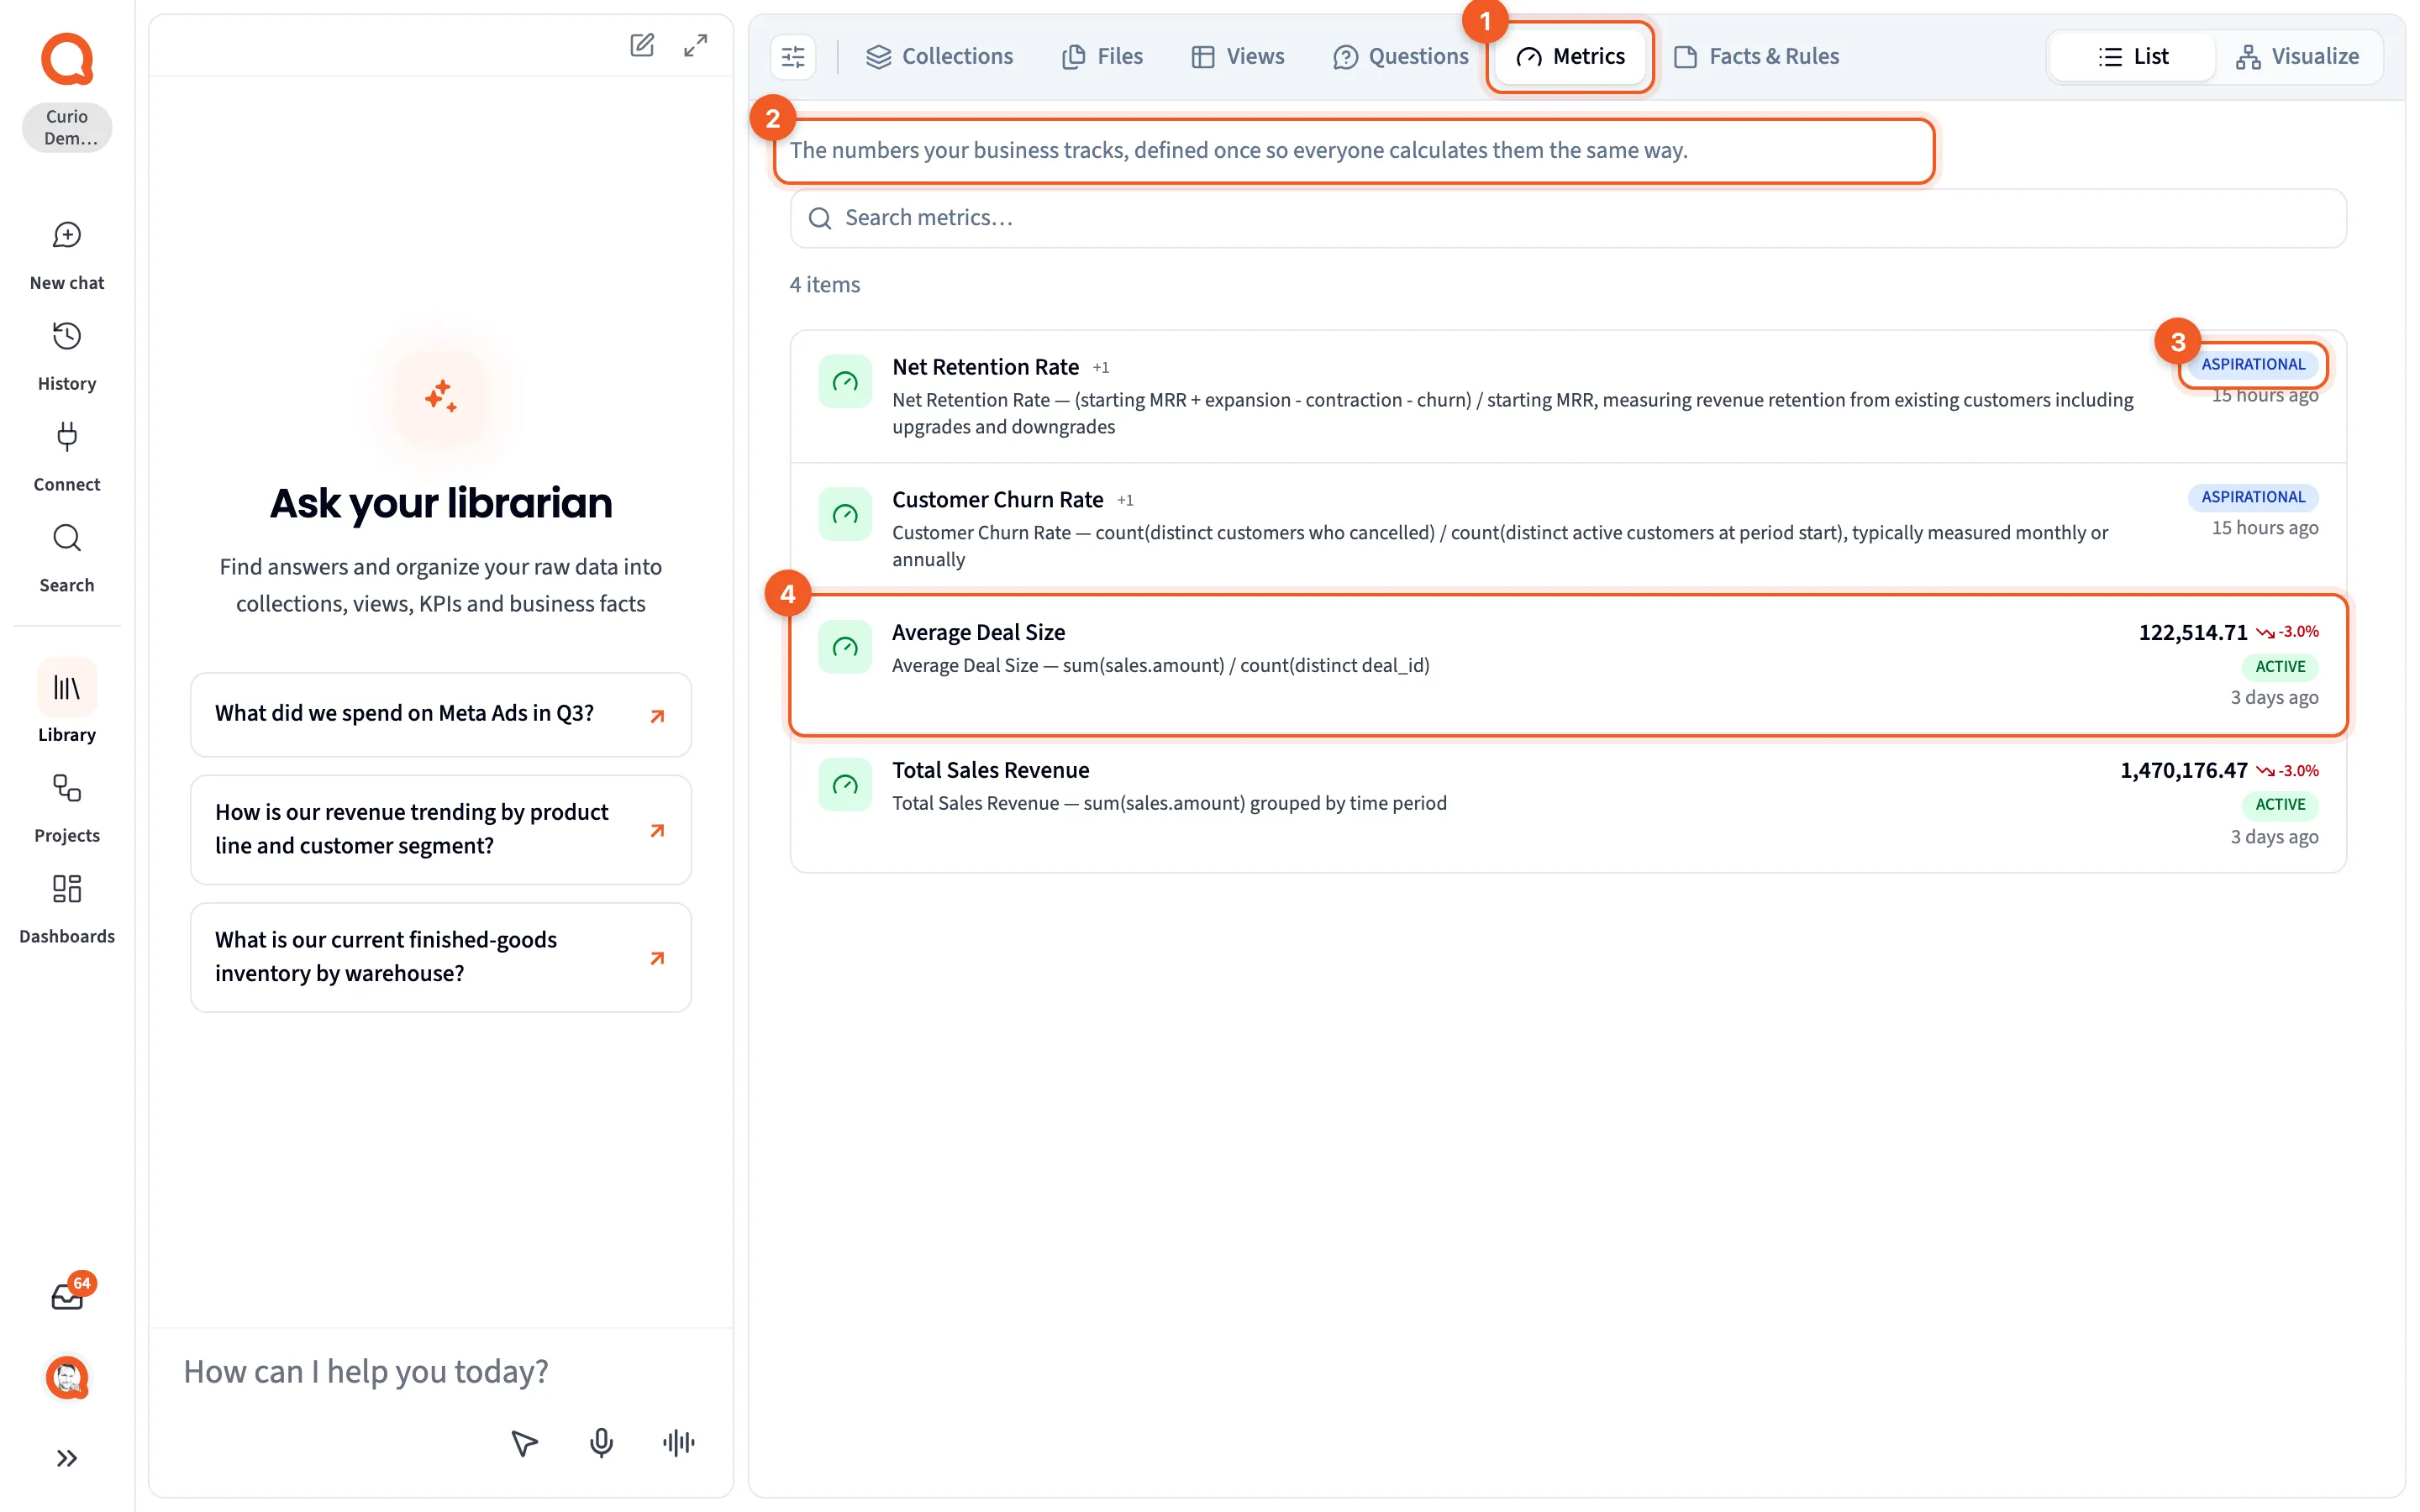
- Metrics: the tab.
- The description: “The numbers your business tracks, defined once so everyone calculates them the same way.”
- ASPIRATIONAL: the KPI’s state.
- A KPI with a value: its name and definition, then its latest value, the change, and ACTIVE.
A KPI answers “what exactly do we mean by this number?” once, for everyone. Each row shows:
- An icon colored by the KPI’s first dimension of business value: green for Revenue, orange for Cost, blue for Efficiency, purple for Quality, red for Risk.
- A “+1” (or more) beside the name when the KPI belongs to more than one dimension.
- The latest value and its change, once the KPI has been computed.
- Its state: ACTIVE, ASPIRATIONAL, DRAFT or DEPRECATED. A deprecated KPI’s name is struck through.
KPIs set up during onboarding start as ASPIRATIONAL. A KPI has no value until it’s measured from a table, which is why the two aspirational rows in the picture show no number. Everything else about a KPI is in its KPI panel. See KPIs.
Facts & Rules
Section titled “Facts & Rules”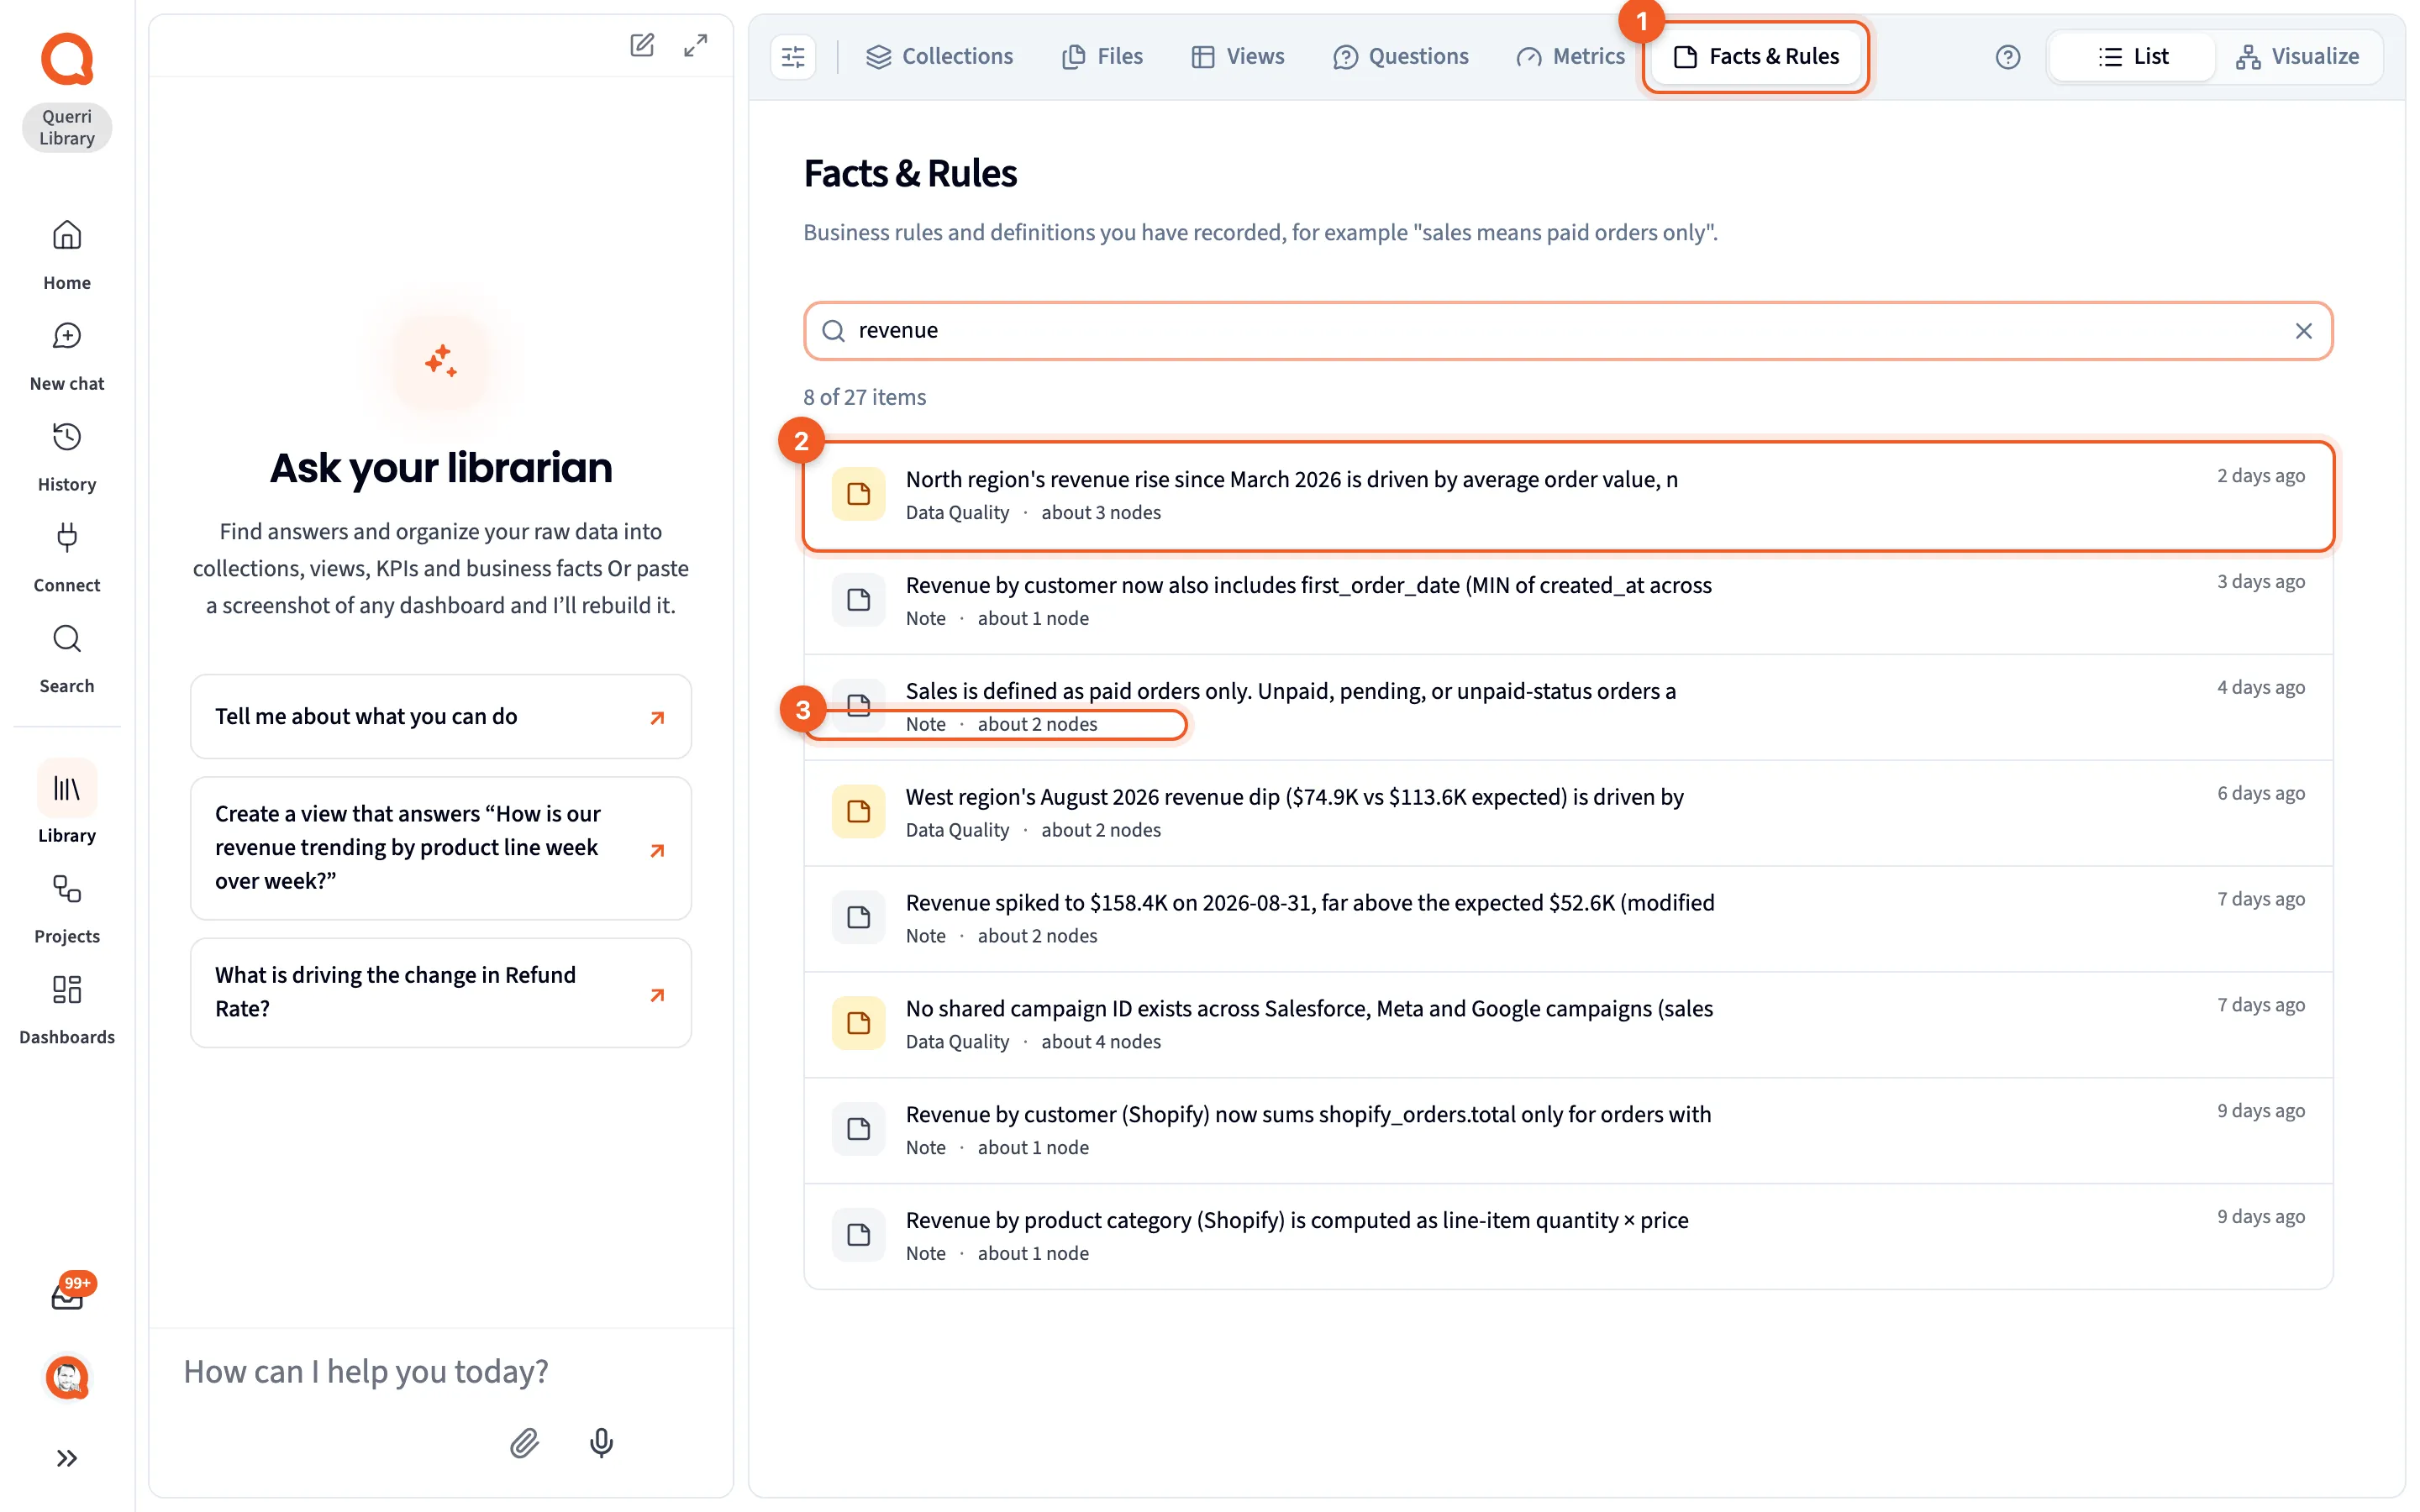
Its description reads: ‘Business rules and definitions you have recorded, for example “sales means paid orders only”.’
- Facts & Rules: the tab itself.
- The start of the fact, cut off after 80 characters. Open the fact to read all of it.
- Its kind — Note, Data Quality, Timing or Scope, which also sets the icon’s color — and “About N nodes”, how many items the fact is attached to. The row doesn’t say which ones, but the fact’s panel does.
A row also shows “N% confident”, but only when confidence is below 100%.
Facts aren’t just notes for people. When Querri writes a query, it takes into account the facts attached to the tables it’s querying. See Facts & Rules.
When a list is empty or won’t load
Section titled “When a list is empty or won’t load”- With nothing in it yet, a tab suggests what to ask the Librarian, such as “Ask the Librarian to propose a metric that matters to your business.”
- If your search matches nothing, the tab says so and offers Clear search.
- If the list can’t load, you’ll see the error and Retry.
- A very long list loads the 200 most recently updated items, and the count says so.