
Wrapped
Esta página aún no está disponible en español. Se muestra la versión en inglés.
A Wrapped turns the charts and tables already in your project into a slide deck. Numbers count up as a slide opens, chart slides use the project’s own interactive charts, and you can present it full screen or take it away as PowerPoint.
Who can see this: anyone who can open the project. Asking for a Wrapped adds a step, so you need to be able to edit the project.
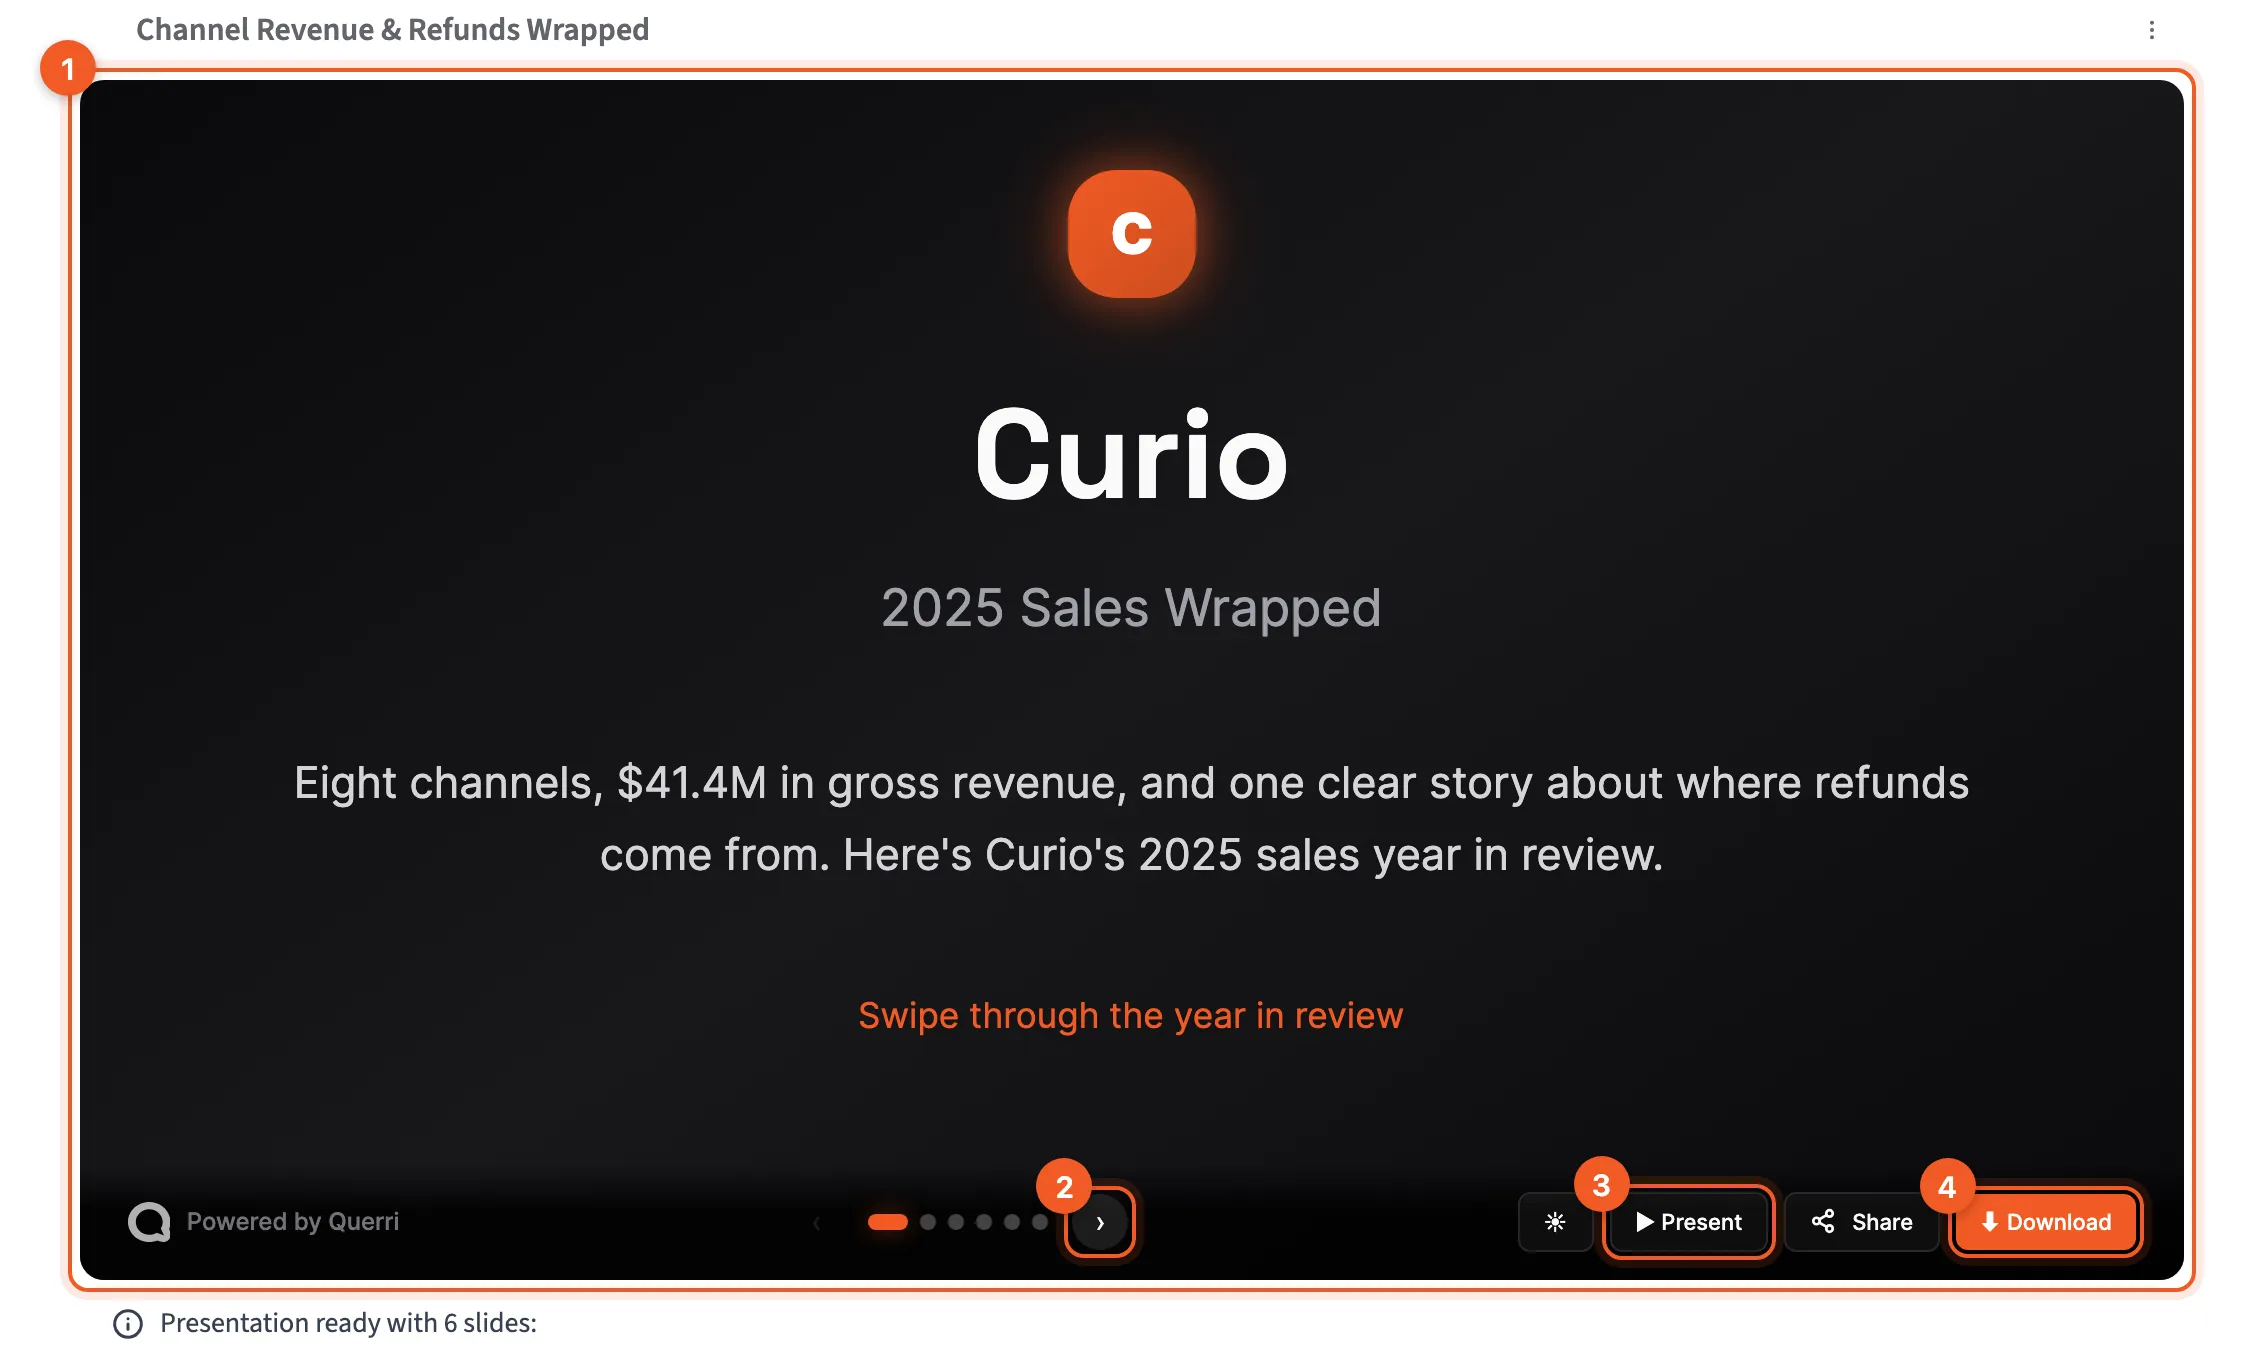
- The deck: the slides play right in project chat.
- ›: the next slide.
- Present: show the deck full screen.
- Download: save it as PowerPoint or PDF.
When to use it
Section titled “When to use it”Use it once the analysis is done and you have to tell someone about it: a leadership update, a quarterly review, a recap for a customer. It works from what’s already in the project and doesn’t run new analysis, so build the charts and tables first.
If people need numbers that keep up to date, a dashboard fits better. For a spreadsheet, use Excel Export.
Ask for it
Section titled “Ask for it”Ask in project chat for a presentation, a summary deck, a data story or a Wrapped. Say who it’s for, what story to tell, and the tone: professional, conversational, data-heavy or an executive summary. For example:
Turn this analysis into a Wrapped presentation for the leadership team: the channel mix, how net revenue trended, and where refunds come from. Keep it an executive summary.
The project needs at least one step with a chart or a table. Without one, chat replies “There is no data in this project to build a presentation from.”
What happens
Section titled “What happens”Querri adds one Wrapped Presentation step and builds the deck inside it. It plans the story, writes each slide, then looks at every slide and rebuilds any that don’t pass. That takes a while, and chat shows progress such as “Generating presentation…” as it goes.
It draws on every chart and table in the project, except steps that failed. Querri picks the layouts and how many slides to make, from designs for a single big number, a grid of KPIs, ranked lists, comparisons, timelines, tables and more. The deck in the picture has six.
Chart slides use your project’s interactive charts, so a project with only tables gets number, list and table slides instead. For colors, hex codes written in Visualization Standards on Context settings win, then your organization’s brand color and palette, then Querri’s orange and blue.
When it’s done, chat says “Presentation ready with 6 slides:” and lists each slide’s title. If a slide couldn’t be built properly, a note says how many used fallback content.
The deck
Section titled “The deck”A bar under the slides holds the controls:
- ‹ and › page through the slides, and the dots jump straight to one. You can also swipe.
- The sun button switches the deck between light and dark.
- Present fills the screen and turns into Exit. While you’re presenting, the arrow keys change slides and Escape leaves. They don’t change slides otherwise.
- Share makes a link to the deck.
- Download exports it.
On a narrow screen the words drop off and only the icons show.
Share opens Create Share Link, already set up for this step. Name the link, and under Advanced options pick when it expires and add a password if you want one, then click Save and Create Link. Only the project’s owner can create links. See Sharing.
Download
Section titled “Download”Download opens Export Presentation. Pick a format and click the export button, which shows the slide count (“Export 6 slides”).
- PowerPoint (Editable), picked at first: charts come out as shapes you can edit in PowerPoint.
- PowerPoint (Pixel Perfect): each slide is saved as a high-quality image, for the closest match to what you see.
- PDF: for sharing and printing.
Your browser builds the file one slide at a time, at 1920×1080, and shows “Exporting slide 3 of 6…” while it works.
The step’s own download menu lists PPTX and PDF too, marked “coming soon”. Use Download on the deck.
In the Data Flow
Section titled “In the Data Flow”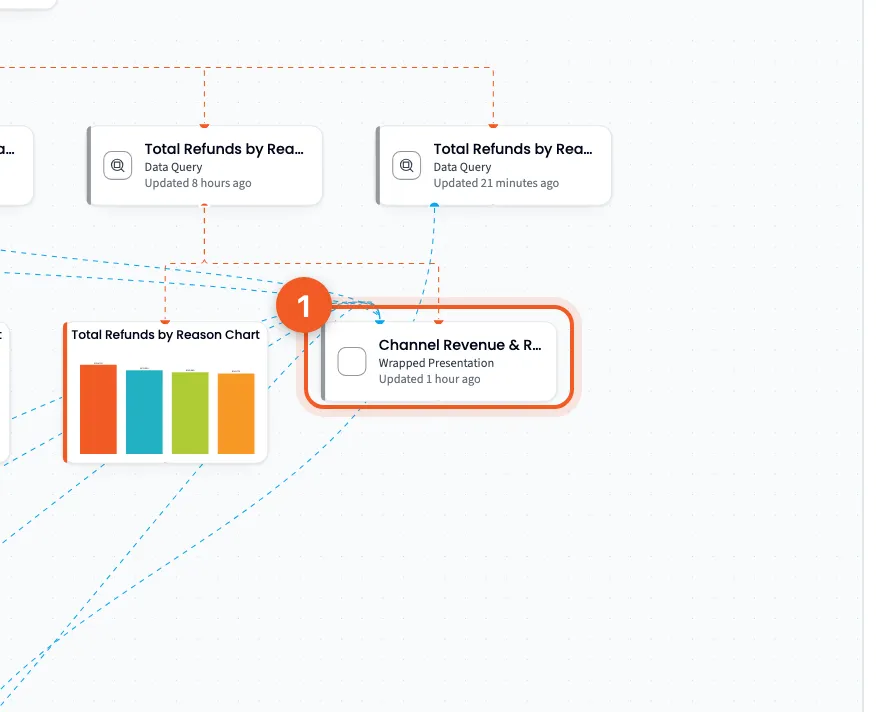
- Wrapped Presentation: the deck’s step.
The step is named after the project, so this one is “Channel Revenue & Refunds Wrapped”. Lines run into it from the charts and tables it used.
Changing the deck
Section titled “Changing the deck”There’s no regenerate button. To change a deck, ask again in project chat and say what’s different: another audience, a tighter story, a different focus.
If it doesn’t work
Section titled “If it doesn’t work”If the deck won’t load, it shows the error with Retry. “No slides in this presentation.” means the step finished with nothing to show, so ask again. And if chat says there’s no data to build from, add a chart or a table to the project first.
Credits
Section titled “Credits”Asking for a Wrapped uses a credit for the question, as usual. Your plan may differ; see How credits are counted on Monitor usage.
- Finish the analysis first. The deck can only use charts and tables that exist.
- Say who’s in the room. “For the leadership team, keep it an executive summary” gets a different deck than “for the analytics team, data-heavy”.
- Name the findings you want told. Otherwise Querri chooses.
- Want decks in your brand colors? An admin can put the hex codes in Visualization Standards.