
Monitor usage
Esta página aún no está disponible en español. Se muestra la versión en inglés.
Monitor usage shows where your organization’s credits went this billing period: the total, one line for every charge, the rates you pay, and breakdowns by person, project, tool, model and connector.
Who can see this: everyone in the organization. Other people’s names and per-person numbers are limited, as described in Who sees whose usage.
Leer la transcripción
See what used your credits
Credits running low, and no idea what used them? Querri logs each thing that uses your organization’s credits. Open Settings, then Monitor Usage. This billing period shows how many of your monthly credits you’ve used, and What used credits lists every charge, newest first: when, what, and who.
See usage by person
For more detail, use the tabs across the top. By user shows what each person used this period, next to their monthly limit. By default, only admins can see it.
See usage by project, tool, and model
Then look at where the work happened. By project splits usage across your projects, and By tool shows the kind of work behind it, such as nightly insights. Curious about the AI side? By model counts the input tokens for each AI model, and By connector shows each connector’s sync runs, failures, and rows synced.
Export usage reports as CSV
Need the numbers in a spreadsheet, or for your finance team? Open Exports and download any of these reports as a CSV file for the current billing period.
Get warned when you near a limit
To catch it sooner, open Usage Alerts. Querri posts a warning here as your organization nears a limit, and another once it goes over. No more guessing where your credits went.
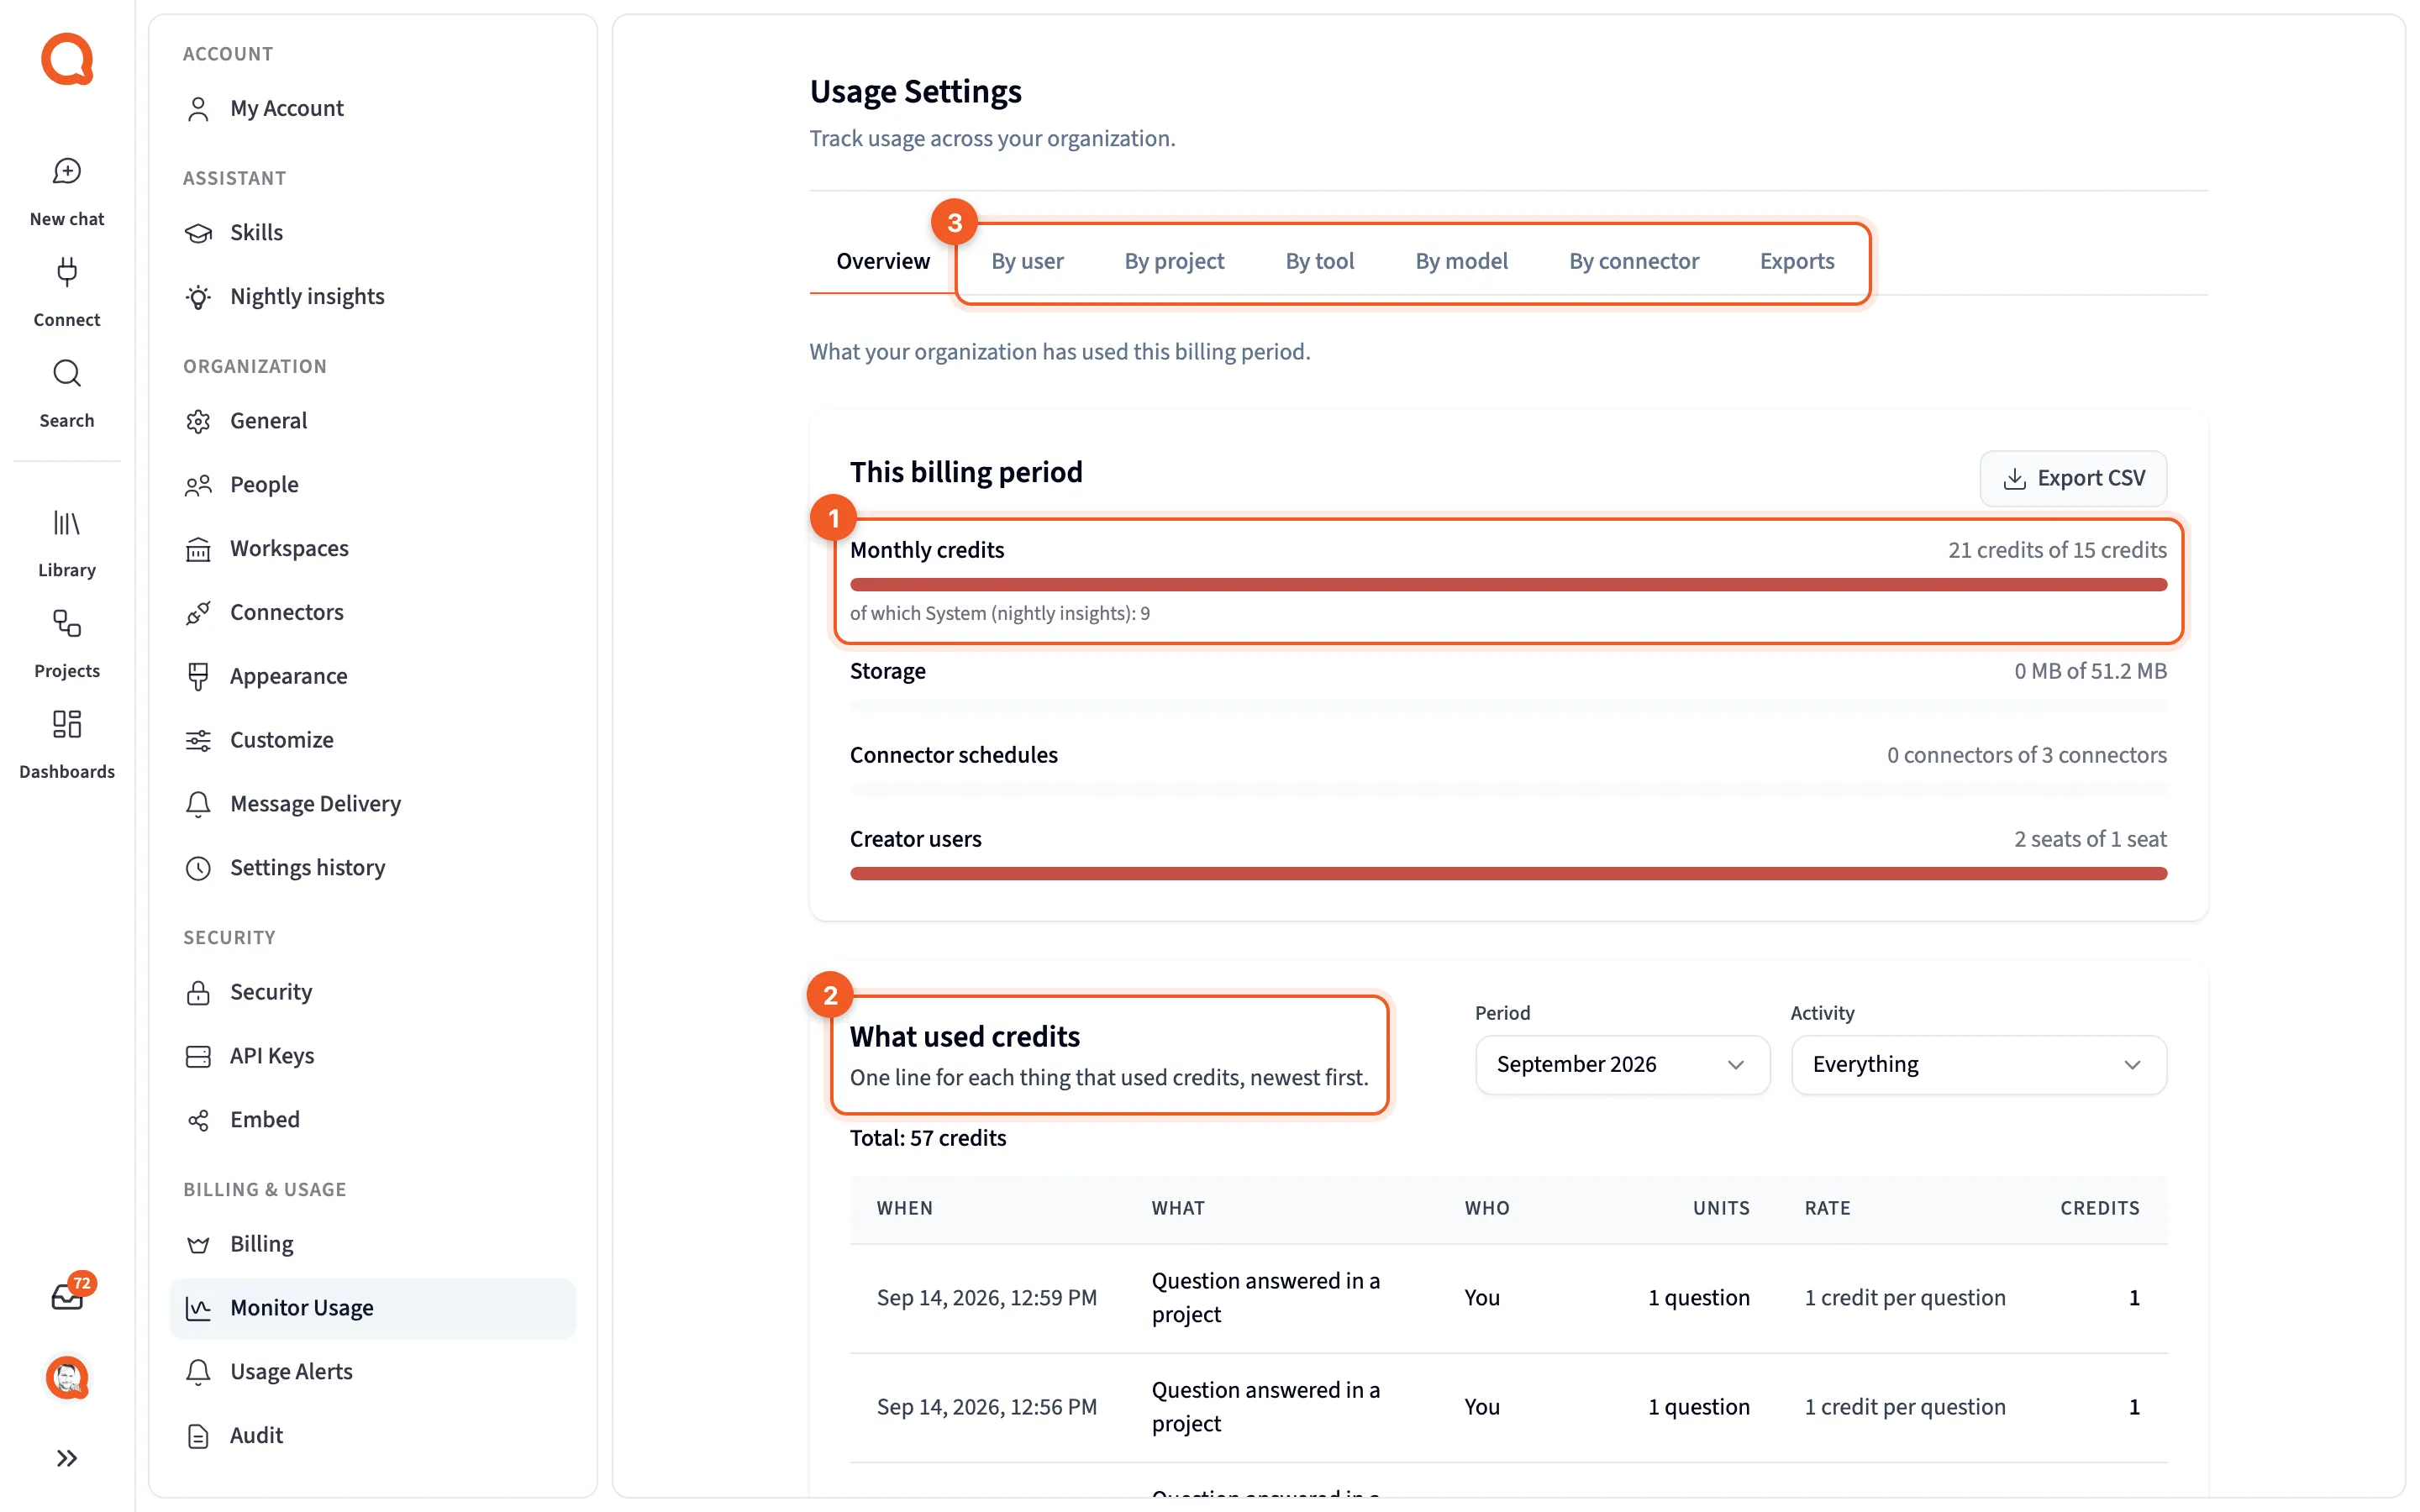
- Monthly credits: the credits you’ve used this billing period.
- What used credits: every charge, newest first.
- By user and the tabs beside it: the same period broken down.
In the Settings rail it’s Monitor Usage, under Billing & Usage. The page itself is titled Usage Settings, and its tabs are Overview, By user, By project, By tool, By model, By connector and Exports.
This billing period
Section titled “This billing period”There’s a gauge for each feature in your plan. Features with no limit only appear once you’ve used them.
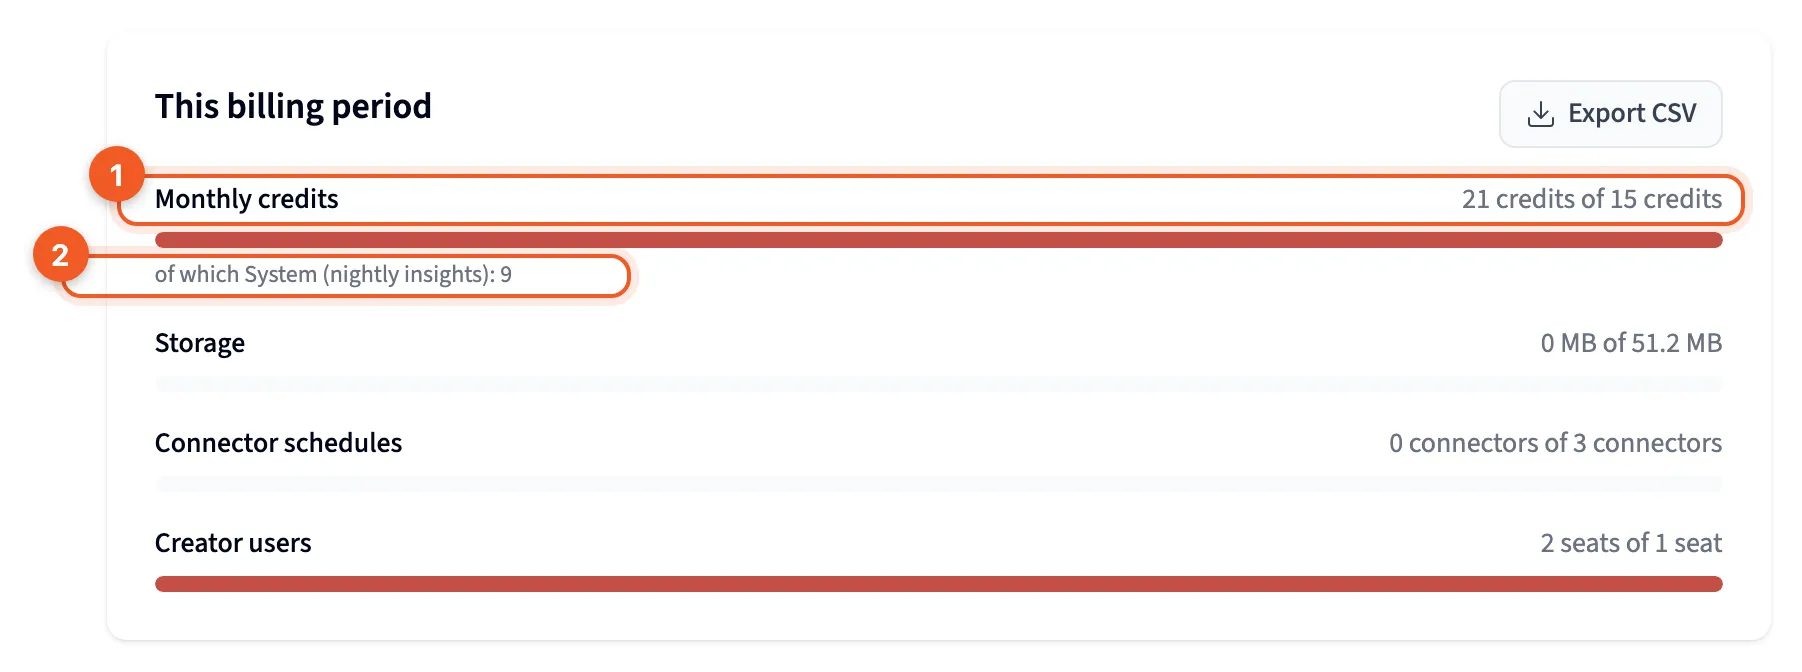
- Monthly credits: “{used} of {limit}”, or Unlimited. The bar turns amber at 80% and red once you’re past 100%.
- of which System (nightly insights): how many of those credits went to nightly insights.
Export CSV downloads the summary.
What used credits
Section titled “What used credits”“One line for each thing that used credits, newest first.”
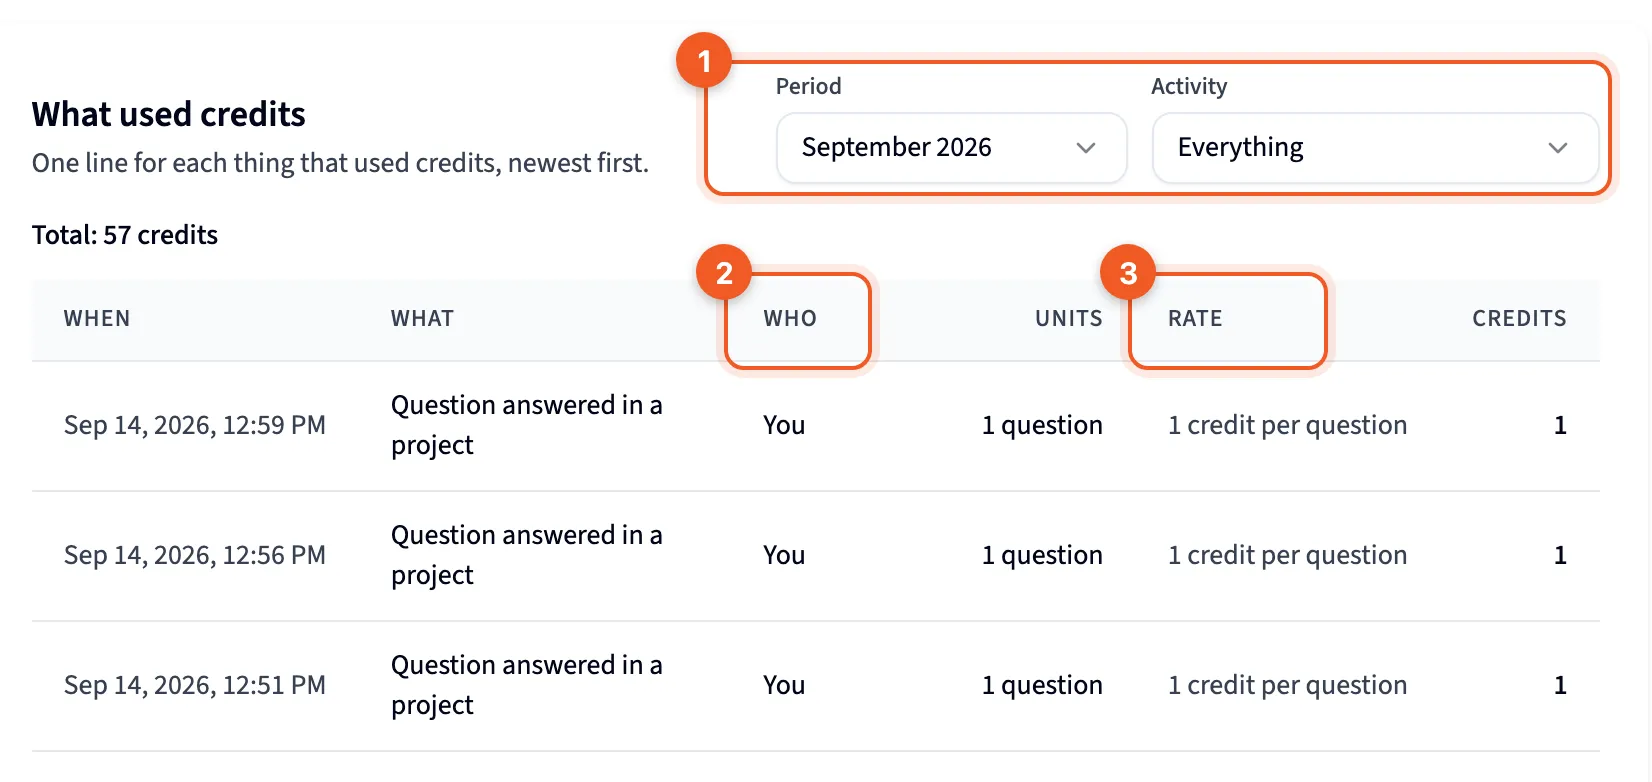
- Period and Activity: this calendar month or either of the two before it, in UTC, and Everything or a single kind of work.
- Who: whose charge it is. It reads You, a person’s name, A teammate, Nightly insights, Scheduled run or Automatic.
- Rate: the rate that applied when the charge was made.
The other columns are When, What, Units and Credits. Above the list, “Total: {credits} credits” adds it all up, and when parts of a credit haven’t reached a whole one yet, it also says how much has been billed. Load more brings in older lines. An empty period reads “Nothing used credits in this period.”
How credits are counted
Section titled “How credits are counted”This panel starts collapsed. Open it to see your organization’s own rates, grouped by how each kind of work is counted. “When a rate changes, the new rate applies to charges made after the change, and earlier charges keep the rate they were made at.”
- Charged each time: the first group of rates.
- Step refinement: parts of a credit that add up through the month.
- Scheduled project run: counted in blocks of 10 steps.
These are the default rates. Your plan may differ, so check the panel for yours.
| What | Default rate | How it’s counted |
|---|---|---|
| Question answered in a project | 1 credit per question | Each time |
| Question asked in the Library | 1 credit per question | Once per turn with the Librarian, including each question to the dashboard assistant |
| Table built in the Library | 1 credit per table | Each time. A build that fails costs nothing |
| Nightly insight analysis | 1 credit per analysis | Each time |
| Connector sync | 1 credit per sync | Only when a schedule runs the sync and something syncs, charged to whoever created the schedule. Syncing by hand and uploading files cost nothing |
| Step refinement | 0.5 credits per refinement | Parts of a credit add up through the month |
| Researcher rows | 0.001 credits per row | Parts of a credit add up through the month |
| Scheduled project run | 1 credit per 10 steps | In blocks of 10 steps, rounded up, with at least one block. A 25-step run is 3 blocks |
Whole credits reach the bill as the month’s running total passes each whole number. A question that runs into an error can still use a credit.
An admin can cap how many credits one person uses each month on People, under Organization in Settings. See People.
Usage over time
Section titled “Usage over time”Usage over time charts Credits Used across the period. Under it, Projected this billing period estimates where the month will land, such as “On track for about {projected} of your {limit} {label}.” If you’re heading past a limit, it says by roughly how much. Early in a period, it waits until there are a few days of usage.
The breakdown tabs
Section titled “The breakdown tabs”By user, By project and By tool split the credits you’ve been billed. Each table shows the name, Amount and % of Total, with Export CSV. A caption reads Updated live for the current period and Updated nightly for earlier ones.
By tool mostly uses the tools’ internal names, like planner and librarian. The exception is the nightly pass, which is written down as Nightly insights, so that’s the row to look for when you’re accounting for overnight work. In By user, the account behind scheduled runs shows as System (scheduled runs) rather than as a person.
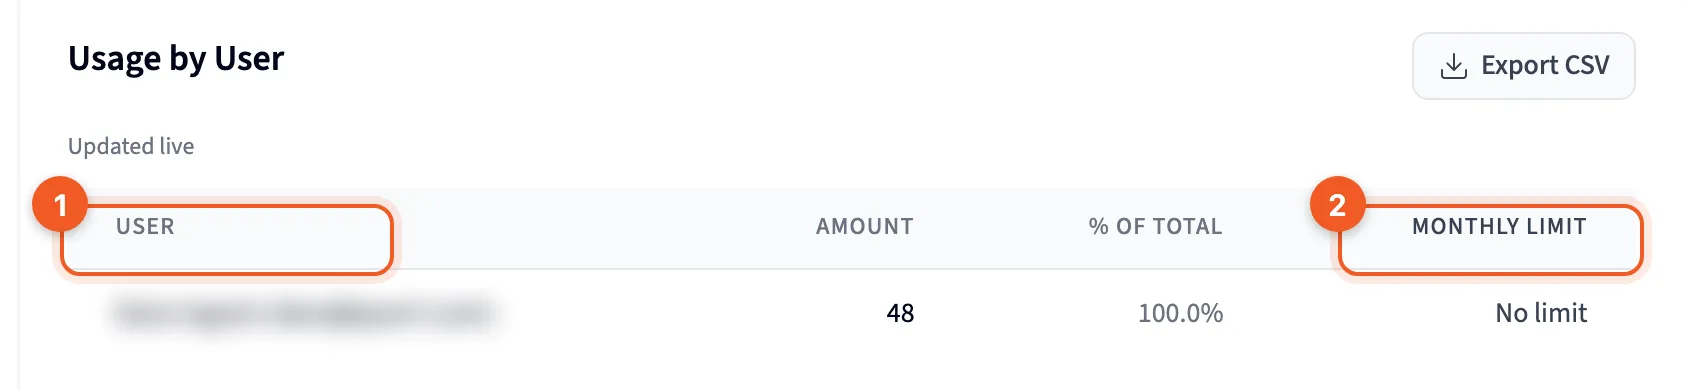
- User: one row per person.
- Monthly limit: “{used} of {cap}” with a bar, or No limit.
Two tabs don’t show credits at all. By model counts input tokens for each AI model. It shows which models did the work, not what the work cost.
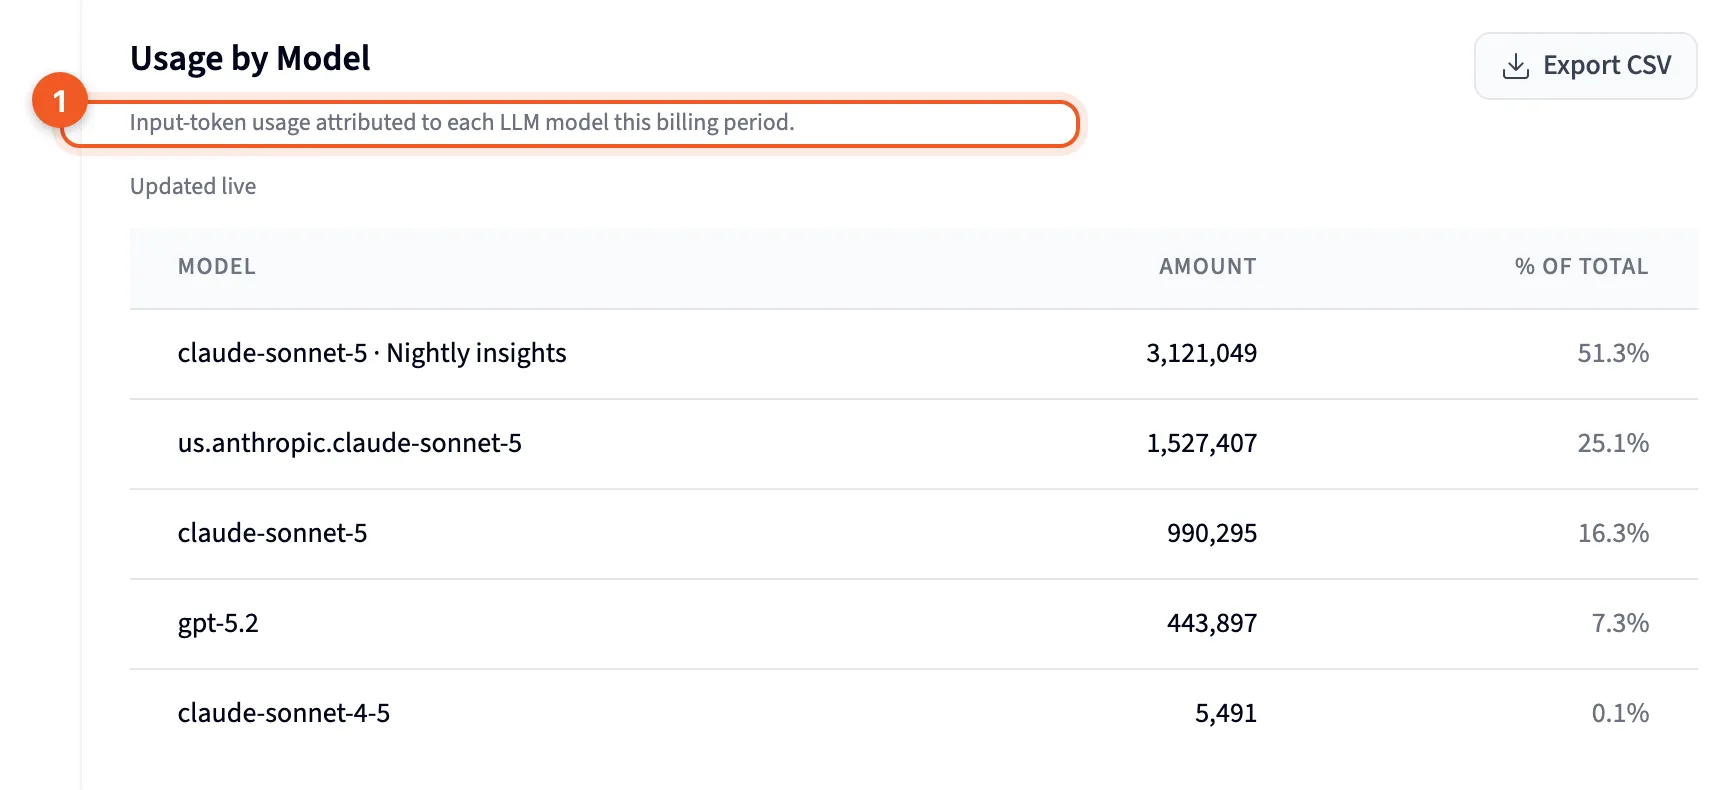
- The subtitle: this tab counts tokens, not credits.
By connector shows sync activity for each Connector, including Success rate, Rows synced and Last sync. A run in this table isn’t necessarily a charge, since only scheduled syncs cost credits.
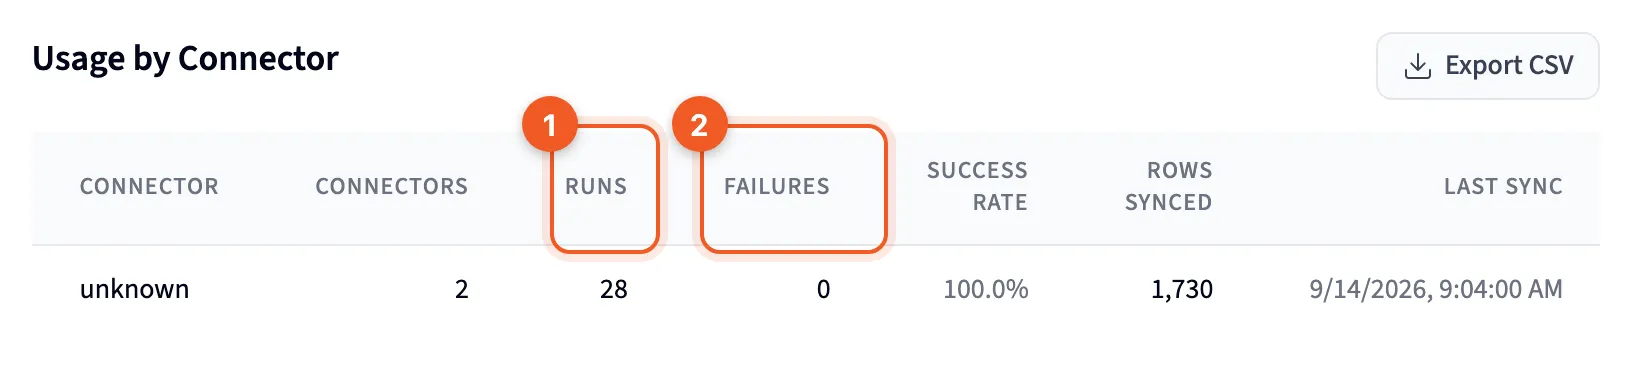
- Runs: how many times each connector synced.
- Failures: syncs that didn’t finish, in red when there are any.
A tab with nothing to show reads “No usage to break down yet for this period.”
Exports
Section titled “Exports”Download usage reports gives you a CSV of any report for the current billing period: the usage summary, the daily usage trend, and usage by user, project, tool, model or connector. Each has its own Export CSV button.
Who sees whose usage
Section titled “Who sees whose usage”Most of this page looks the same for everyone. Two things change with your organization role and with Per-user privacy, which an admin sets on Usage alerts.
- What used credits: members see names only on their own lines. Everyone else’s lines read A teammate, and the totals still add up. With Strict, admins see it that way too.
- By user depends on Per-user privacy:
- Admins only (recommended), the default: admins see everyone. Members see “Per-user usage is restricted to organization admins.”
- All members: admins see everyone, and each member sees only their own row.
- Strict: nobody sees it, admins included.
Members also don’t get the Usage by user export.