
Dashboards
A dashboard puts charts, tables and numbers from your projects on one page, with filters and headings, so your team can read them in one place.
Who can see this: everyone. The Dashboards page lists the dashboards you can open, and anyone who can open one can use Present. Only a dashboard’s owners and editors see Edit, Share and Automate.
Read the transcript
What a dashboard is
A dashboard is where your work lands: the charts and numbers your team checks every week, on one page, filtered, shared, and kept up to date. A dashboard doesn’t do the analysis. Your project does. It works out the numbers, step by step… and the dashboard is where those charts land, side by side, for everyone else. And it stays current. Each widget reads its step again every time the page loads, and when the projects behind it run, the numbers move with them… so nobody is reading last month’s report.
Start a dashboard
Starting one, Querri asks how you want to begin. Describe the dashboard you want and it sets up a project to build it. Start a project first, and build the charts beside a blank page. Paste a picture of a dashboard you already have, and Querri rebuilds what it can see. Or start blank. Here’s the one that shows how they fit together. Querri makes the project and the dashboard, puts them side by side, and asks the project’s first question for you. Ask the project for what you need. When a chart is ready, it lands on the dashboard you have open… underneath whatever’s already there.
Arrange it yourself
Then it’s your page. Drag the seam between two widgets to resize… the page is twelve columns wide, and it tells you what you’re taking. Or drag one by its handle to move it, and it saves as you go.
Change it by asking
The easiest way to tidy a dashboard in Querri is to ask. On any dashboard, the chat panel’s first tab is Dashboard. In edit mode, it can rename it, add a heading, move things around, or restyle the page. It reads the dashboard in front of it, so “make this tidier” is a real instruction. Ask for a filter, and it adds one to the page: pick a value and every chart that reads that column narrows with it. Your choice is saved for the team; a viewer’s choice stays in their own browser. Design is the same conversation. Ask for a different look, or name a theme, and every chart changes together… and if you don’t like it, one click puts the whole reply back.
Filter, share and refresh
When it’s ready, share it. People you name get it as a viewer, an editor or an owner… and each of them sees it through their own access, so one page can serve a whole company. Or put it on the screen in a meeting, on its own. And set it to look after itself. Automate runs the projects behind it again, daily, weekly or monthly, so the page is ready before anyone asks. Build the analysis once in a project, put it on a page, and let your team filter it, share it and trust that it’s current.
The Dashboards page
Section titled “The Dashboards page”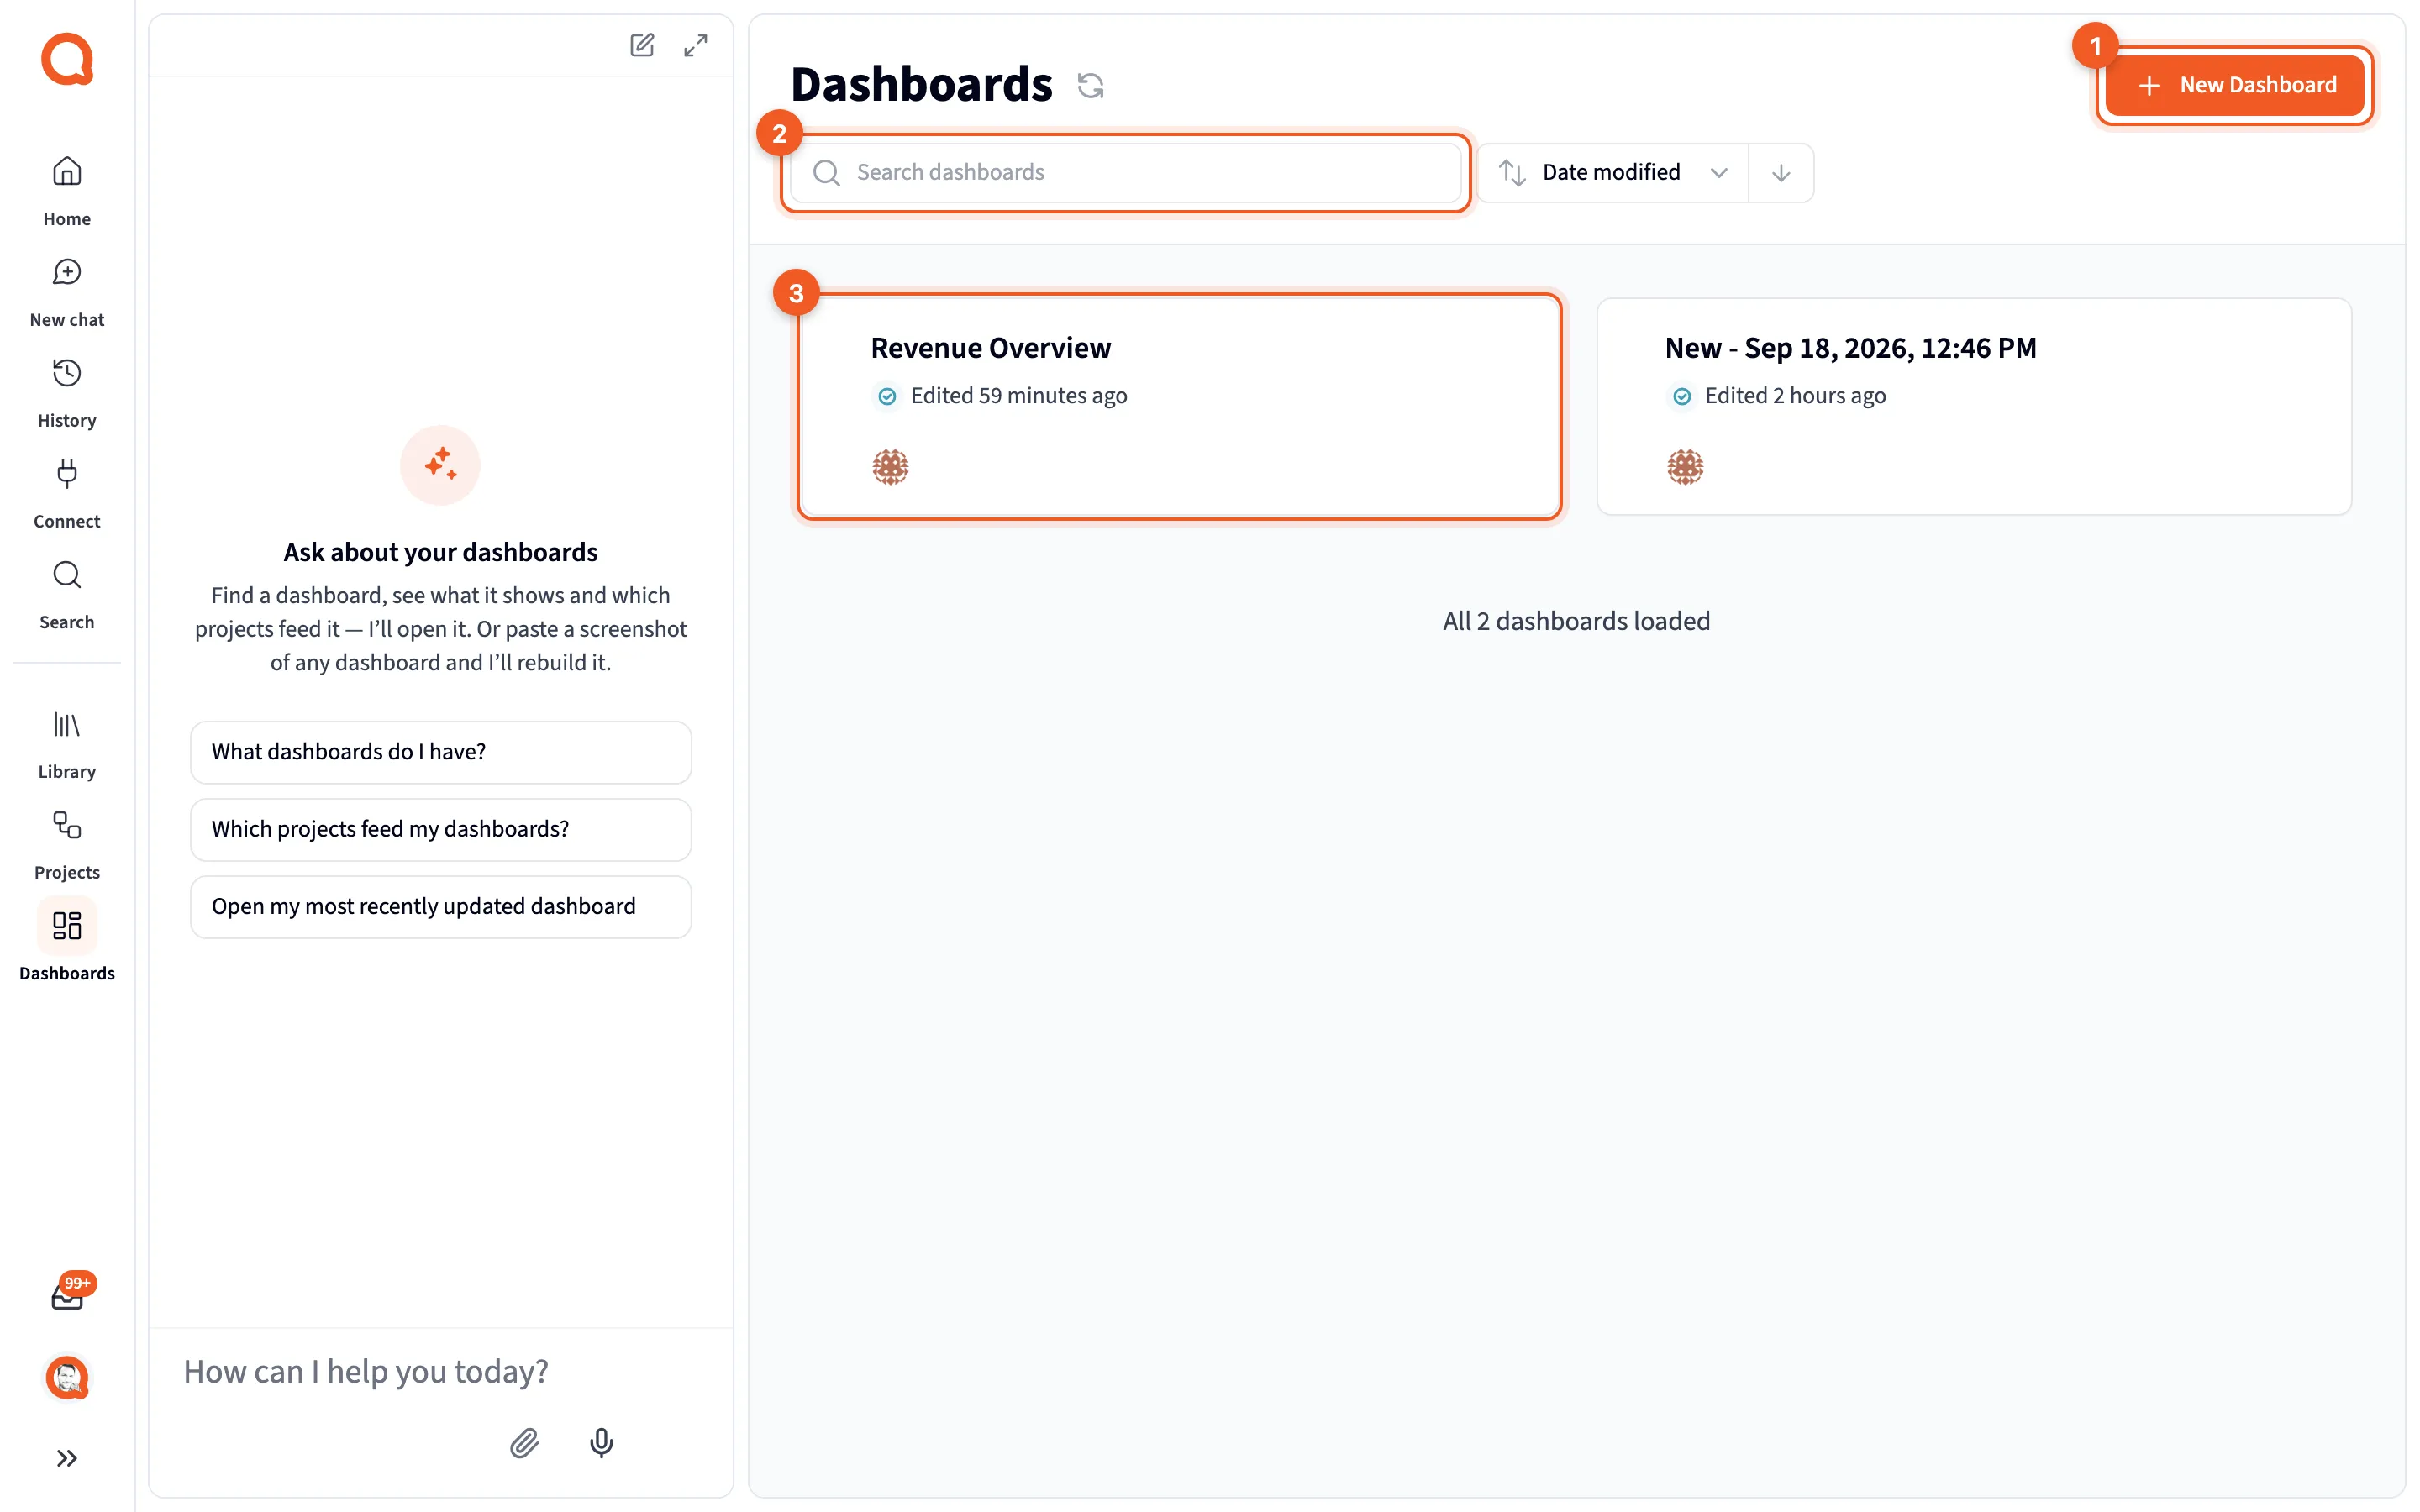
- New Dashboard: choose how to start.
- Search dashboards: find one by name.
- A dashboard card: click it to open the dashboard.
Sort by Date modified, Name or Status, and flip the order with the arrow beside it. Each card shows the name, a status icon, when it was last edited and up to three avatars.
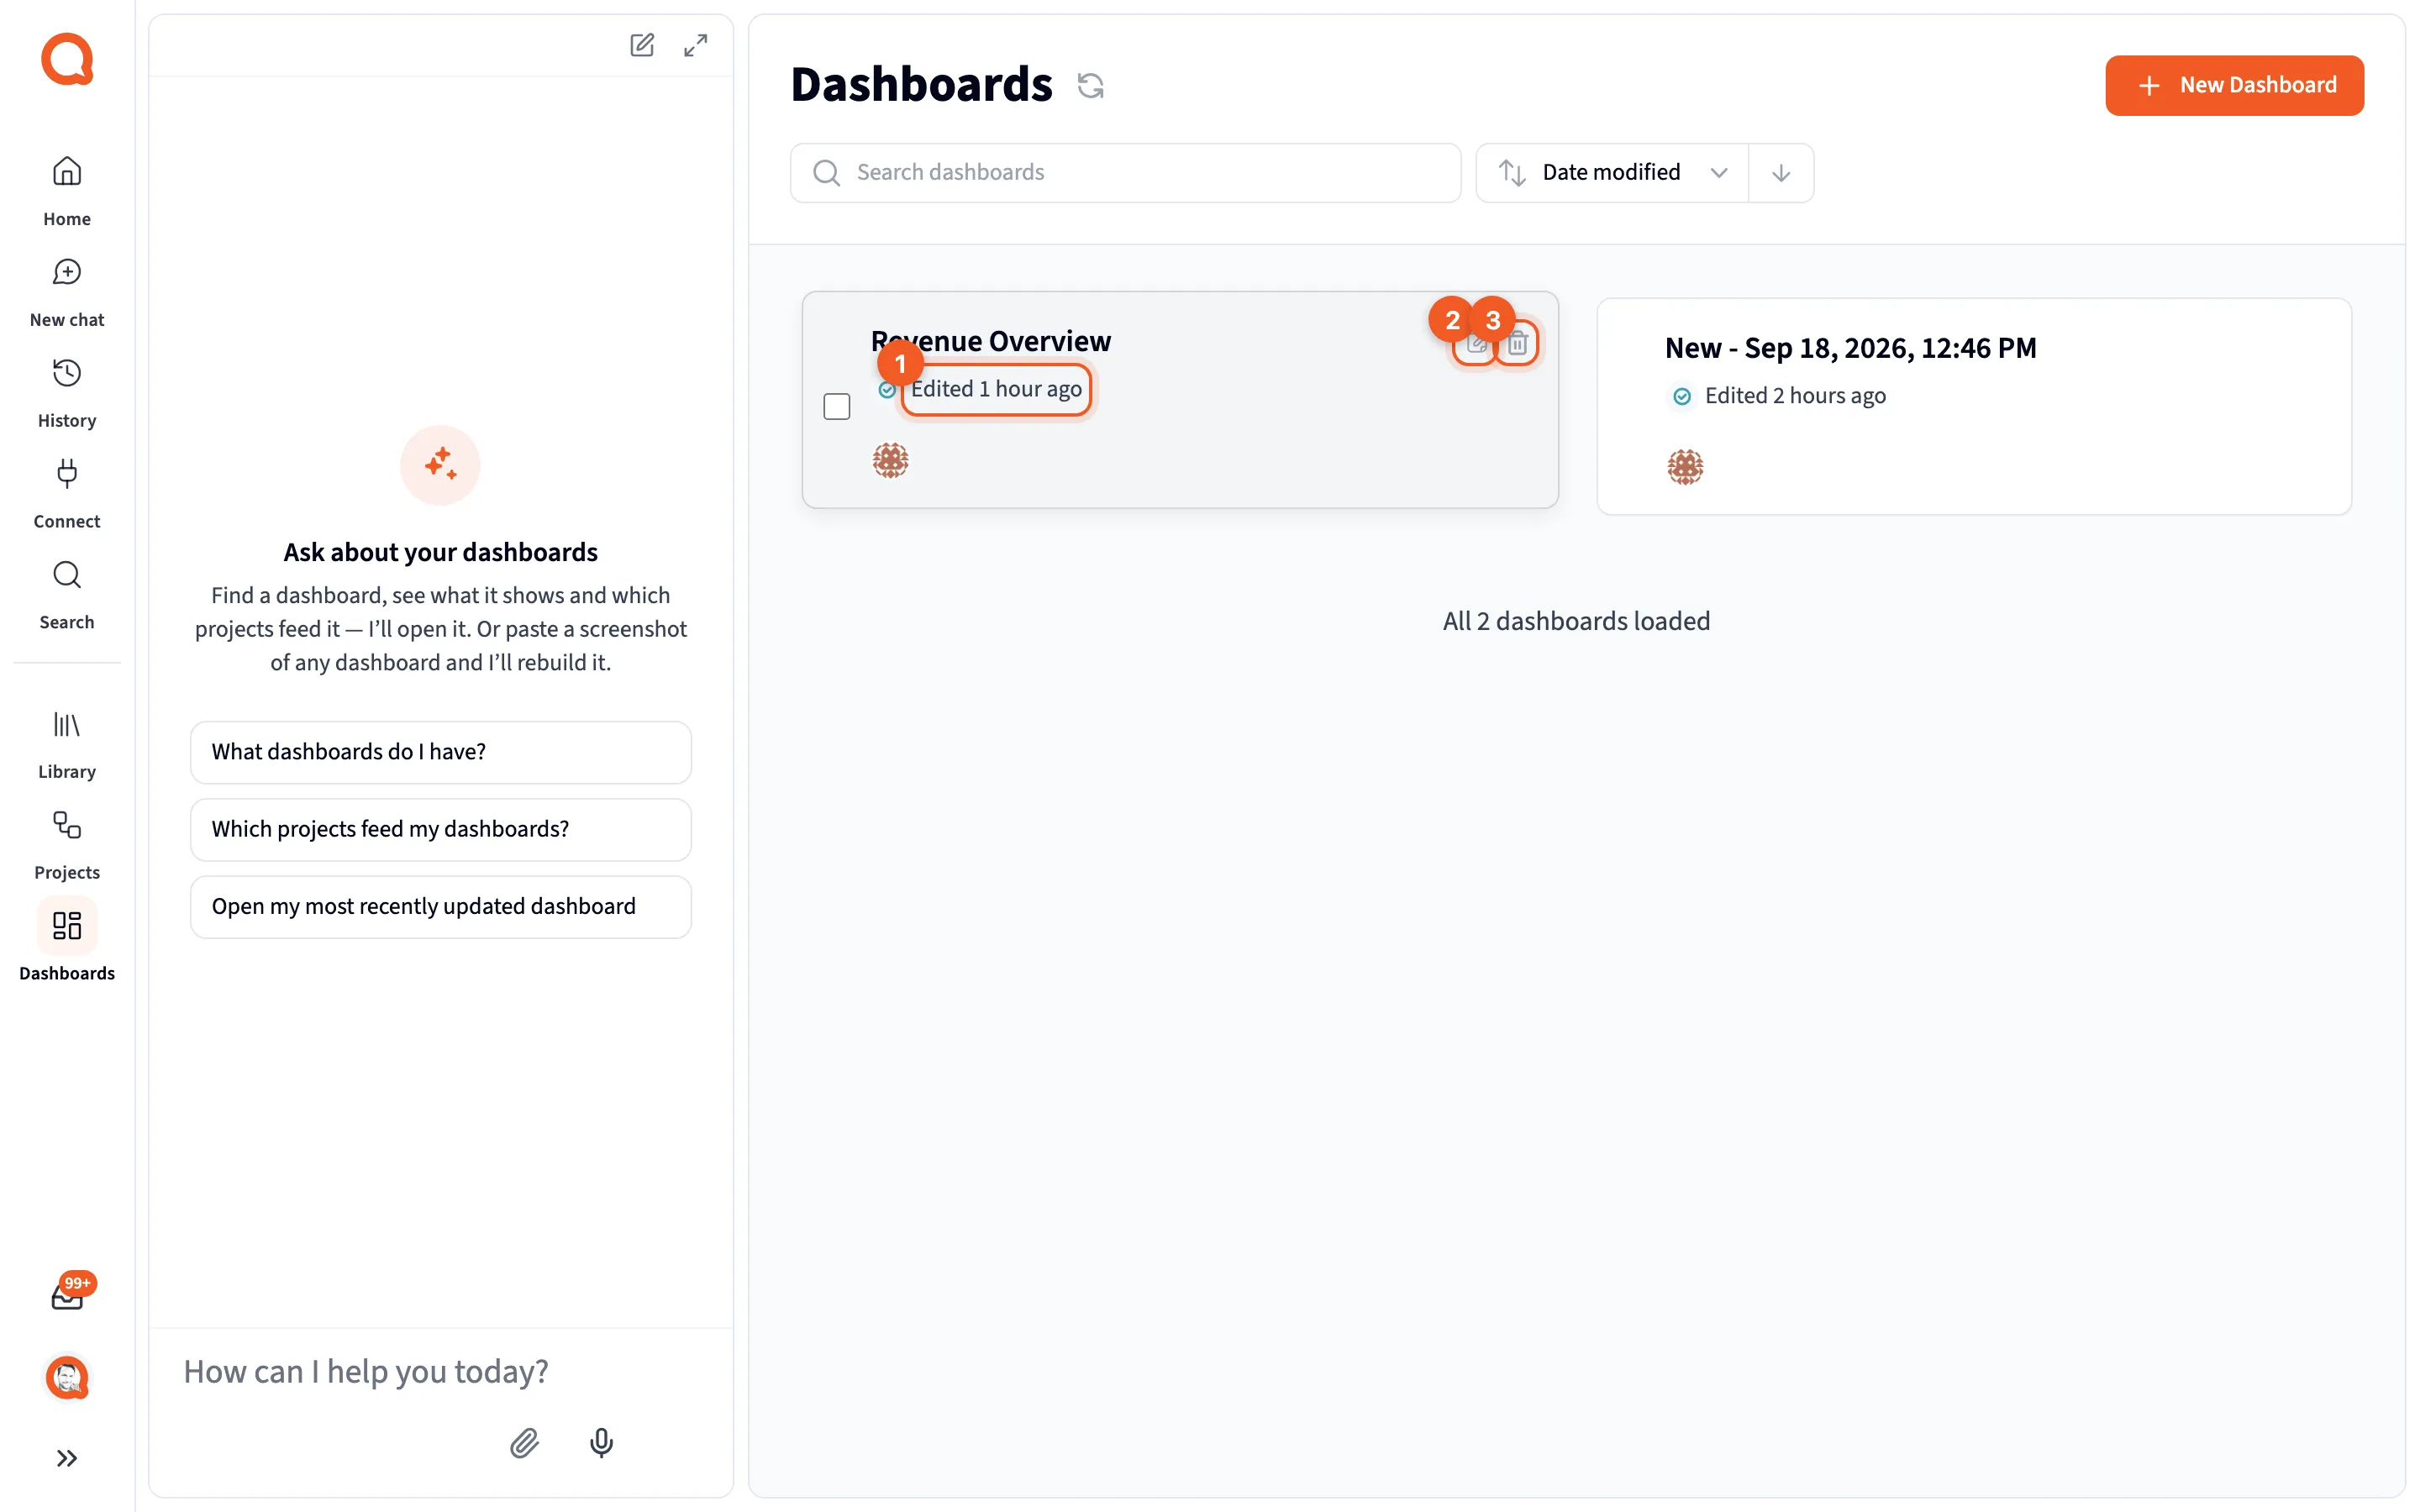
- Edited: when the dashboard last changed.
- Edit dashboard: rename it, or change its description.
- Delete dashboard: delete it.
Only the person who created a dashboard can delete it. Everyone else sees Leave dashboard instead, which removes their access until the owner shares it again. Select several cards to delete them together, if you created them all.
Choosing how to start
Section titled “Choosing how to start”New Dashboard doesn’t make a dashboard. It fills the chat panel with a question about how you want to start, and nothing is created until you pick a path.
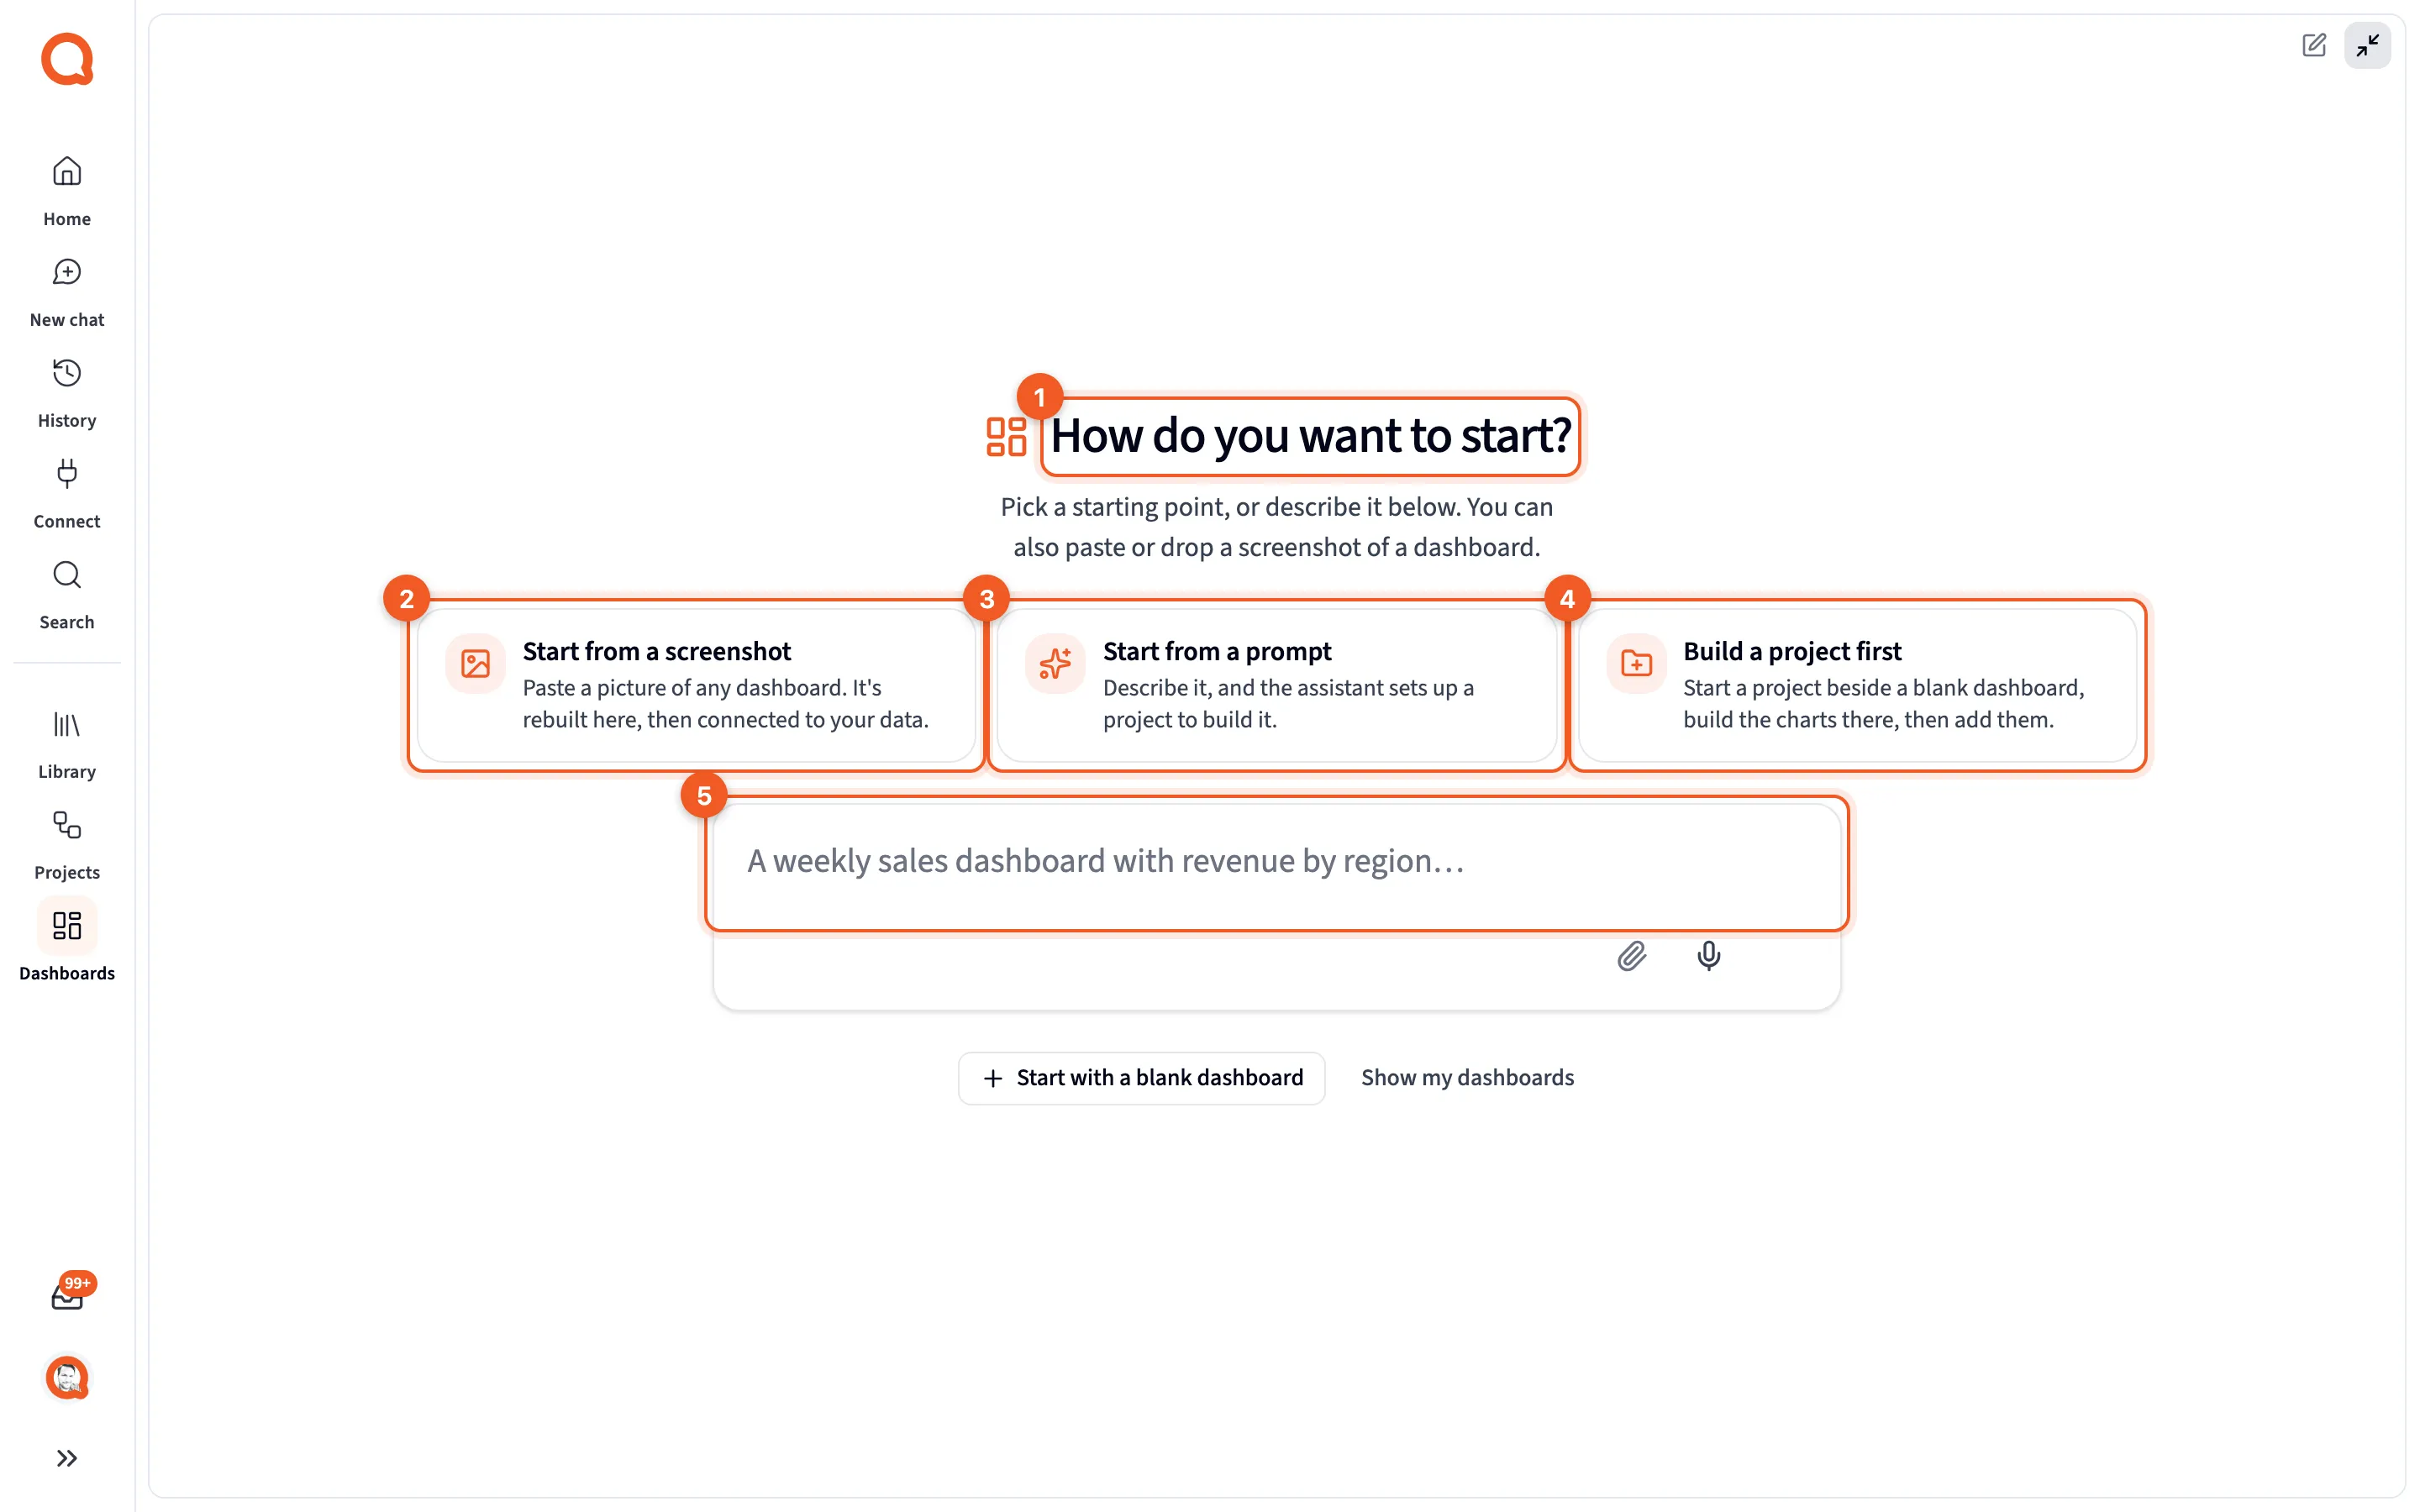
- How do you want to start?: the heading, or Build your first dashboard when your organization has no dashboards yet.
- Start from a screenshot: rebuild a picture of a dashboard.
- Start from a prompt: describe what you want.
- Build a project first: a project and a blank dashboard, side by side.
- The box: describe the dashboard in your own words.
- Start with a blank dashboard: an empty dashboard, straight away.
Under the heading it says “Pick a starting point, or describe it below. You can also paste or drop a screenshot of a dashboard.”
| Card | What pressing it does |
|---|---|
| Start from a screenshot | Opens the file picker for a picture. Nothing is created: the picture goes with your next message. See Build a dashboard from a picture |
| Start from a prompt | Puts “Build a dashboard that shows ” in the box and leaves the cursor there. If you’d already typed something, your words are kept |
| Build a project first | Makes an empty project and a blank dashboard, links them, and opens the dashboard in edit mode with the project as a tab in the chat panel. It sends the project’s first question for you, asking it to help pick the sources, build the charts and add them to the dashboard beside the chat |
| Connect your data first | Opens the Add data dialog. It takes the place of Build a project first when your organization has nothing to query yet |
The box under the cards takes a description, such as “A weekly sales dashboard with revenue by region”. Whatever you send from there goes to the Librarian, which works out what to build rather than making a dashboard on the spot.
Below that sit two quieter buttons. Start with a blank dashboard makes an empty dashboard named with the date and time and opens it in edit mode, which is what New Dashboard used to do on its own. Show my dashboards closes the panel and leaves you on the list.
When it opens. When you press New Dashboard, when you go to /dashboards?new, and when the list has finished loading with nothing in it. It doesn’t open over a list that is only briefly empty while it loads or refreshes, a load that failed, a search that matched nothing, or an organization you emptied during this visit. Close it and the list’s own empty state is behind it, with a Choose how to start button that opens the panel again.
Closing it. Minimize puts the chat panel back to its usual size. Anything you typed is kept, and anything already made stays made.
Choosing a path costs nothing. Only the questions cost credits: a message you send from the box is one question to the Librarian, and the question Build a project first sends is one question in that project, 1 credit each. See Credits.
Building from a picture
Section titled “Building from a picture”Paste, drop or attach a picture of a dashboard in the chat panel, send it with any wording, and Querri rebuilds what it can see: the same widgets, in the same places, on data it generates to match the numbers in the picture or on your own sources. Start from a screenshot is the shortcut to the same thing, and it opens the file picker rather than creating anything. Where you start decides what you get: from Dashboards you get a dashboard, and from Projects you get a project instead. See Build a dashboard from a picture.
Getting charts onto a dashboard
Section titled “Getting charts onto a dashboard”Charts and tables always come from a project; you can’t add one by hand. Adding a project’s step to a dashboard needs you to own that project, or Querri says “You can only share from projects you own”.
Ask the project for a dashboard
Section titled “Ask the project for a dashboard”In a project’s chat, ask for one, such as “Create a dashboard from this analysis for the sales team, with the net revenue trend by channel and the 2025 totals table.” The project arranges its finished charts and tables, usually 4 to 12 of them in 2 to 4 rows, with no headings. Where they land depends on where you asked.
- From a project tab beside a dashboard you can edit, the widgets are added below what’s already on the canvas, and the canvas fills in while you watch. When you asked the project for a dashboard, the reply carries a card headed Added to this dashboard, with no button, since you’re already there. A turn that only adds a chart shows no card; the chart simply appears.
- Anywhere else, it makes a new dashboard and saves it to Private with only you as owner, even when the project is shared. Share it when it’s ready.
- Dashboard created: the project made a dashboard.
- The name and widget count.
- Open Dashboard: open it.
Either way, the request counts as one question in the project, 1 credit.
Ask the Librarian for a dashboard and it proposes a new project, which then builds one. That project is linked to the dashboard you have open, so it arrives as a tab in the chat panel.
Drag a chart from the project chat
Section titled “Drag a chart from the project chat”On a dashboard, the chat panel has a Dashboard tab and one project tab at a time, with a chevron for the rest. A project tab is that project’s own chat, so you can build a chart there and drop it straight onto the dashboard.
- Open the dashboard and click Edit. Charts can only be dragged in edit mode.
- Pick the project’s tab in the chat panel. If you came from that project’s chat, choose Stay in project chat. To bring in another project, use Add a project to this chat.
- Ask for a chart, such as “Chart monthly Square revenue by store location as a bar chart.”
- Point at the result. It grows a Chart tab and a grip, both labeled “Drag onto the dashboard canvas to add as a widget”.
- Drag it onto the canvas.
- Chart: drag the tab onto the canvas.
- The grip: or drag from here.
The dashboard assistant covers the tabs themselves.
Add to Dashboard
Section titled “Add to Dashboard”Add to Dashboard is on result cards and on steps in the Data Flow.
- From a dashboard’s project tab, while you’re editing that dashboard, it puts the chart on the canvas right away, and a brief message says it was added to this dashboard.
- Anywhere else, it opens a list of dashboards. Pick one or more and click Add, or make a New Dashboard. The chart joins that dashboard’s Available Widgets but isn’t placed yet. Open the dashboard, click Edit, and drag it from the Content panel onto the canvas.
- The dashboard list: pick one or more.
- New Dashboard: make a dashboard for this chart.
View mode
Section titled “View mode”Dashboards open in view mode.
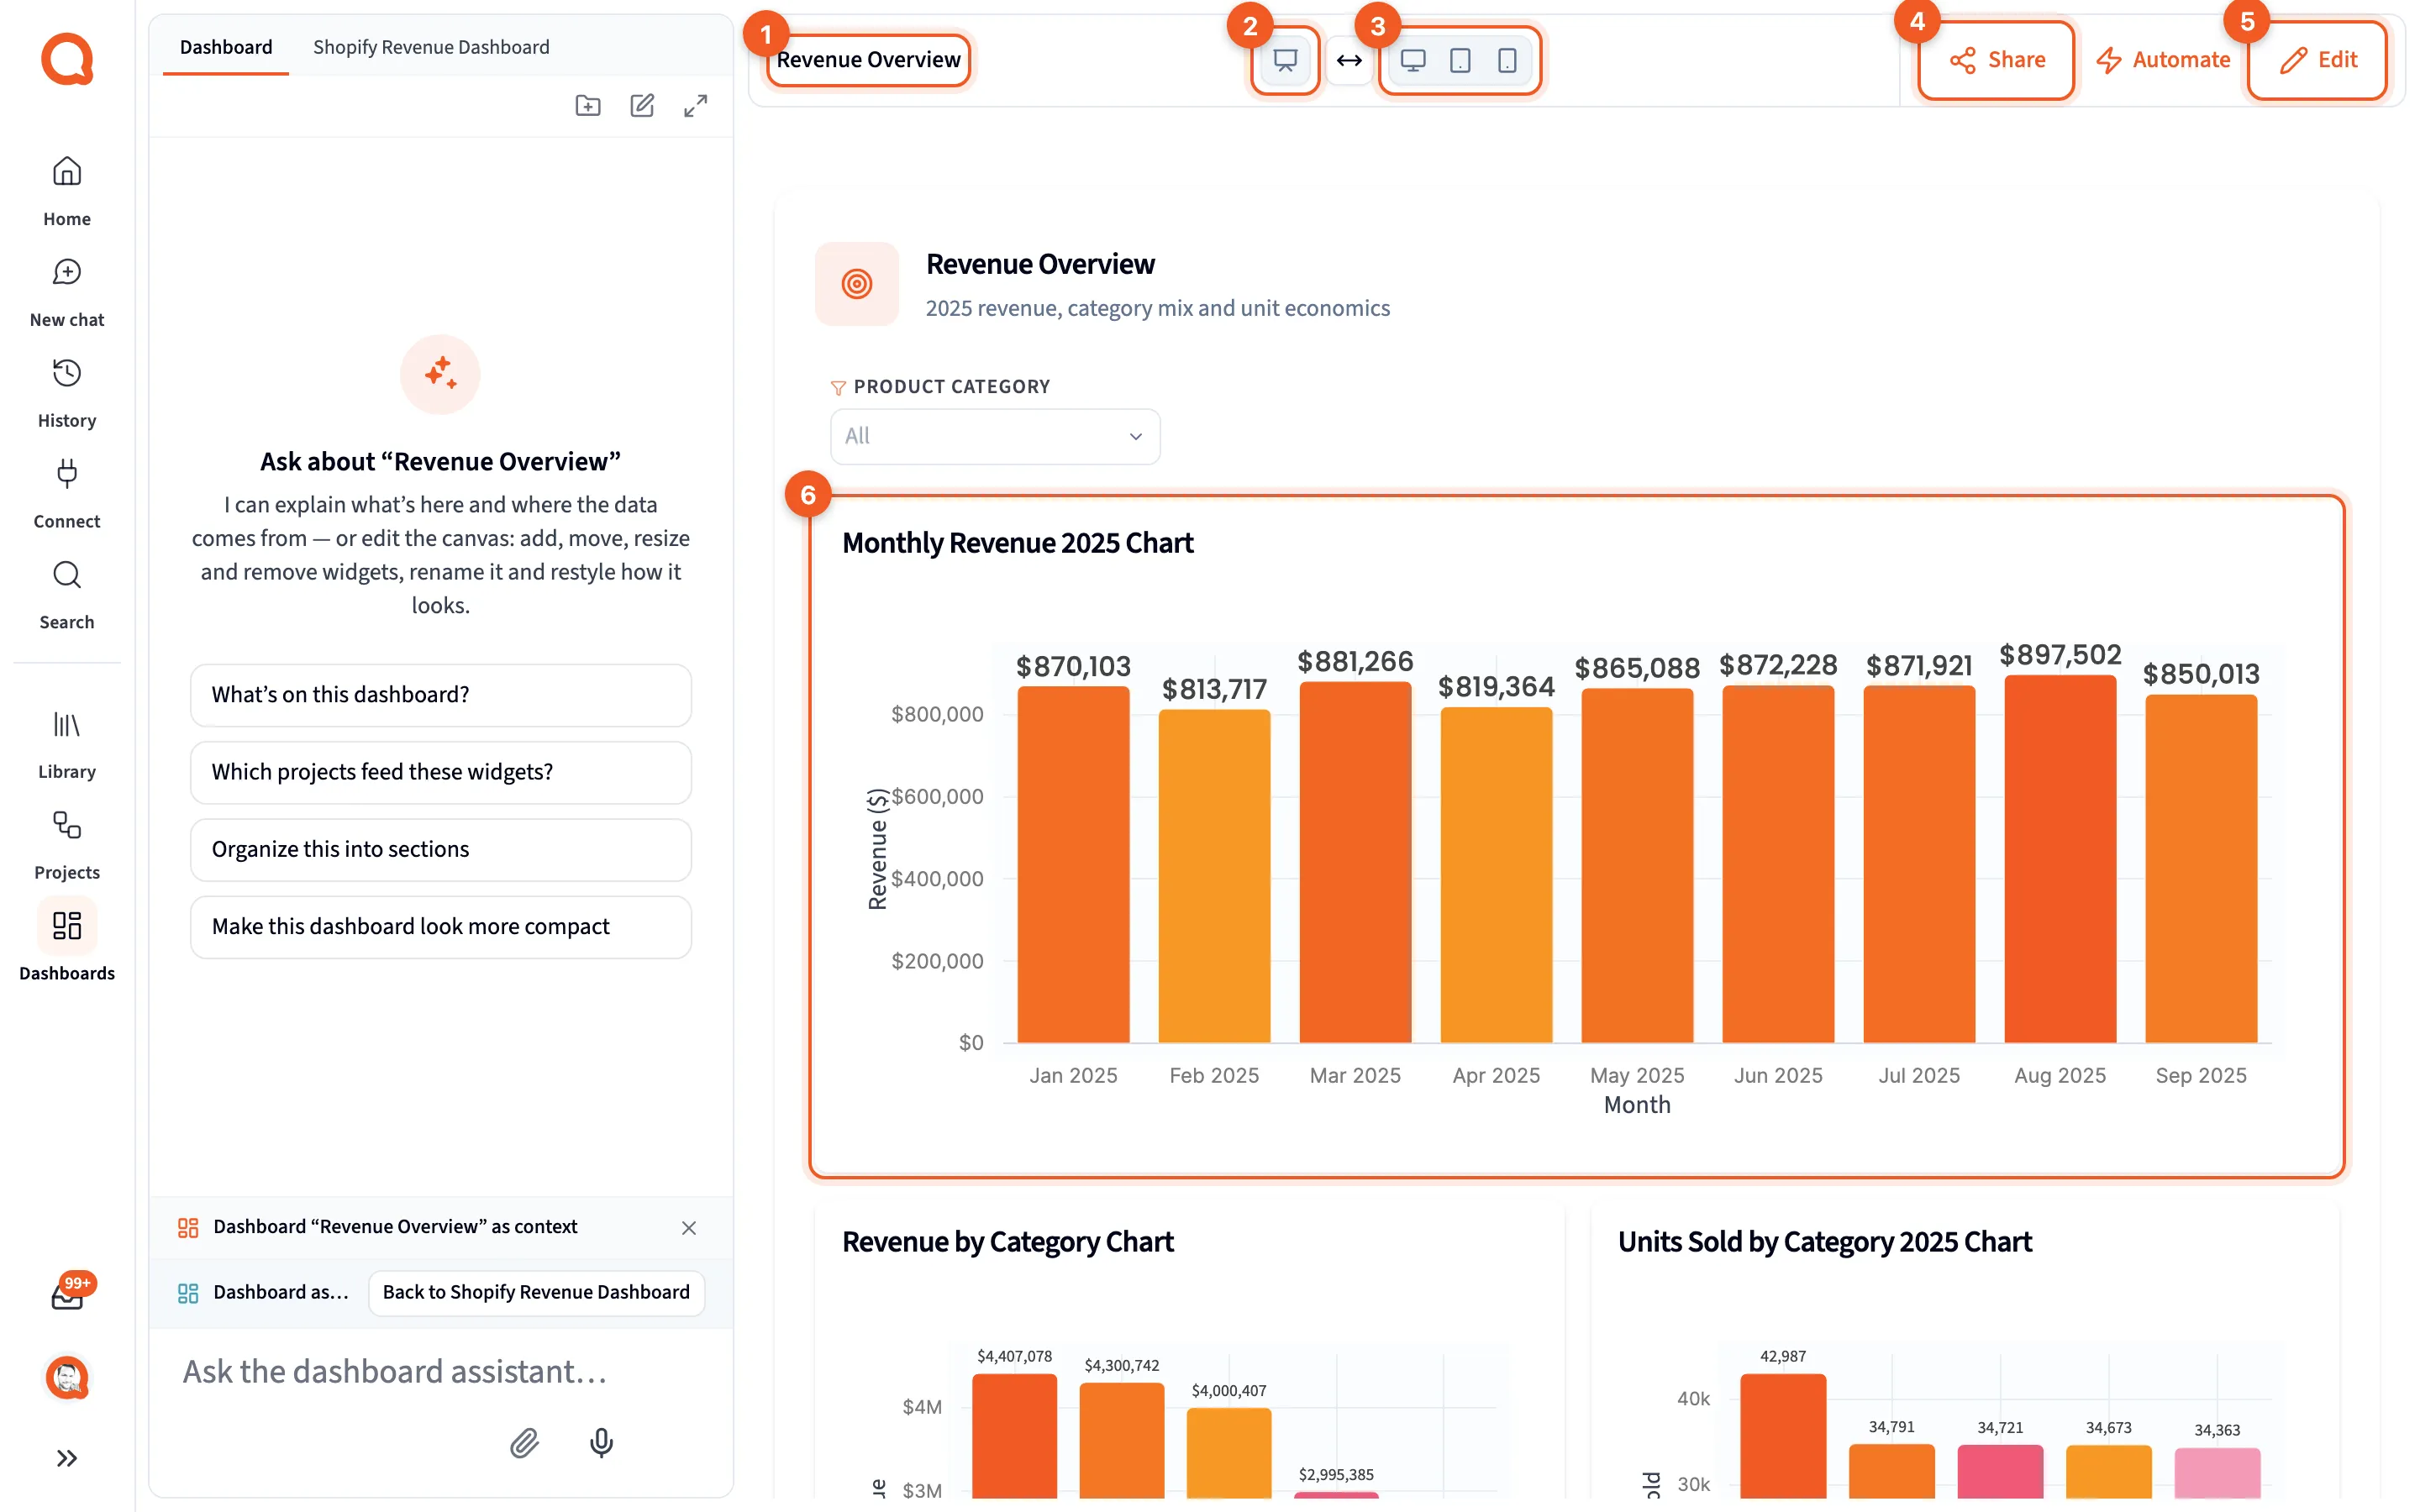
- The title: click to rename the dashboard. Only owners and editors can save a new name.
- Present: open the dashboard on its own, with none of the app around it.
- The viewport pills: preview the dashboard at another width.
- Share and Automate: share the dashboard, or refresh its data on a schedule.
- Edit: arrange and style the dashboard.
- A widget: a chart, table or number from a project.
The header runs left to right: the Querri logo and the dashboard’s title. A small glyph appears beside the title once there’s something to say about saving, and its tooltip says which: a spinner for Saving changes…, a green check for All changes saved, an amber dot for Unsaved changes, or a red dot when a save failed. On a dashboard you haven’t touched, nothing is there. In the middle sit Present, Stretch to full width and the viewport pills, Desktop view (1280px), Tablet view and Mobile view. On the right sit Share, Automate and Edit. All three on the right need edit rights, so a viewer sees nothing there at all. Below a tablet width the middle and right of the header aren’t drawn.
There’s no refresh button. A dashboard’s data updates when its automation runs; see Automate. Filters sit on the canvas as widgets; see Filters.
A chart’s Project button, and the widget’s own Open data source in the Ask panel, open that project as a tab in the chat panel rather than taking you away from the dashboard. Neither points at the step behind the chart; to trace a number, see Checking where a chart came from.
An empty dashboard says “Let’s build something beautiful!”. Its hint about an “Available Content” pane means the Content panel in edit mode, and its last line, Open a project in the Ask panel, opens the project picker.
Present
Section titled “Present”Present opens the dashboard at an address of its own, with none of the app around it: no rail, no chat panel and no header. Just the page frame and the widgets, on the dashboard’s theme, drawn the way a share page draws them.
Anyone who can open the dashboard can present it, viewers included, and presenting writes nothing. It isn’t offered inside an embed. Unlike a public link, a presented dashboard carries no Powered by Querri footer. To show a dashboard to someone who can’t open it in Querri, publish a link instead; see Sharing and automating dashboards.
- The brand line: a monogram and your brand name.
- The title and subtitle: the page frame above the grid.
- The widgets: the dashboard itself, with no app chrome.
- The footer: the page frame below the grid.
The page frame
Section titled “The page frame”The page frame is the text drawn around the grid: a brand line with a monogram of initials, a title and a subtitle above the widgets, and a footer below them. It’s text only, so the brand is initials rather than a logo. It’s drawn on the editing canvas, on a share page and in Present.
Set it in edit mode with nothing selected, in the properties panel’s Page frame section: Header (None, Title or Brand and title), Brand, Title, Subtitle and Footer. Typing a title, subtitle or brand while Header is None turns the header on for you. The dashboard assistant can fill the same fields; see The dashboard assistant.
Edit mode
Section titled “Edit mode”- Available Widgets: charts and tables added to this dashboard, ready to place.
- A drag handle: move a widget.
- The canvas zoom picker: fit more of the dashboard on screen.
- The properties panel: settings for the dashboard, or for the selected widget.
- Done: save and go back to view mode.
Edit opens the properties panel on the right, and you can drag its left edge to make it wider. The Content panel opens on the left too when the dashboard is empty. Widgets and the properties panel covers both.
- Canvas zoom. The picker in the header shrinks the canvas to 90%, 80%, 75%, 67% or 50%, so you can see more of a long dashboard while you arrange it. Ctrl or ⌘ with a scroll or a trackpad pinch over the canvas does the same; a plain scroll still scrolls. It never goes above 100%, it’s only in edit mode, and the level is remembered in the browser you’re using rather than on your account. Share pages, Present and embeds are never scaled.
- Saving. Changes save on their own within seconds, Done saves and leaves edit mode, and Cmd+S or Ctrl+S saves right away. If you leave with unsaved changes, Querri warns you, and later offers Recover Draft or Discard Draft.
- Undo and redo. Use the arrow buttons in the header, or Cmd+Z and Cmd+Shift+Z (Ctrl+Y on Windows). Undo keeps the widget you were working on selected, so the properties panel stays where it was. Removing something raises a message with its own Undo.
- Screen size. Editing needs a tablet or desktop screen. On a phone-sized screen, Querri asks you to switch.
An empty canvas in edit mode is a dashed drop zone telling you to drag widgets from the sidebar, style the dashboard in the properties panel, and share or automate it when you’re ready. It also says you can paste a screenshot of a dashboard into the chat panel to build one from it. Three hand-drawn arrows point out the same three things, once per person.