
Monitors and alerts
A monitor watches one number on a view or table, split by up to two columns, and tells you in the Inbox when one part of it moves away from its usual level.
Who can see this: anyone who can see the KPI or view being watched. Setting up a monitor needs edit access to the table it watches. If you can see only some of that table’s rows, a monitor shows how it’s set up but not its numbers.
There’s no monitors page and no monitor settings page. Monitors show up in the Watching section of KPI and view panels, on each monitor’s own panel, as Something changed cards in the Inbox, in email to the people on a monitor’s delivery list, and as a small heartbeat mark beside the view they watch on the Visualize canvas.
Watching
Section titled “Watching”- Watching: the monitors on this item.
- A monitor: its name, with when it last checked, what it’s broken down by, or paused. Click it to open the monitor’s panel.
- Monitor this: set up another monitor.
On a view’s panel, Watching sits below the view’s facts. On a KPI’s panel, it’s right under the value.
Monitor this only appears when there’s something to watch:
- A KPI’s monitor watches the KPI’s Measured from table, so a KPI without one has no Monitor this.
- The table needs a date column and a numeric column. If a view lacks one, the button is turned off with the reason, and Want a monthly version of this view to watch? asks the Librarian to build one. That starts a Librarian chat, which uses a credit.
Start watching
Section titled “Start watching”- Measure: the numeric column to watch. Views only.
- Break it down by (optional, up to two): columns that split the number into slices, such as region, store, rep or channel.
- Start watching: create the monitor.
Pick up to two breakdown columns, or none to watch the table as one number. On a KPI the choices come from column names alone, so you may not get any. If you want a breakdown, start from the view.
After Start watching, Querri writes the monitor’s query for you, and the monitor takes its first reading the next time the view builds.
Accepting a Worth watching card in the Inbox also sets up a monitor, on the KPI the card is about.
How it decides, and when it checks
Section titled “How it decides, and when it checks”A monitor compares each slice with its own history, never with the other slices. It takes the middle value of the last 15 periods as the usual level, then flags a period that sits unusually far from it, a level that stepped up or down and stayed there, or a steady trend. It needs at least 14 periods first, it doesn’t account for seasons, and you don’t set thresholds. Monitors explains the rest.
It checks every time the view it watches finishes building, not on a nightly schedule. Check now on its panel runs it straight away.
The monitor panel
Section titled “The monitor panel”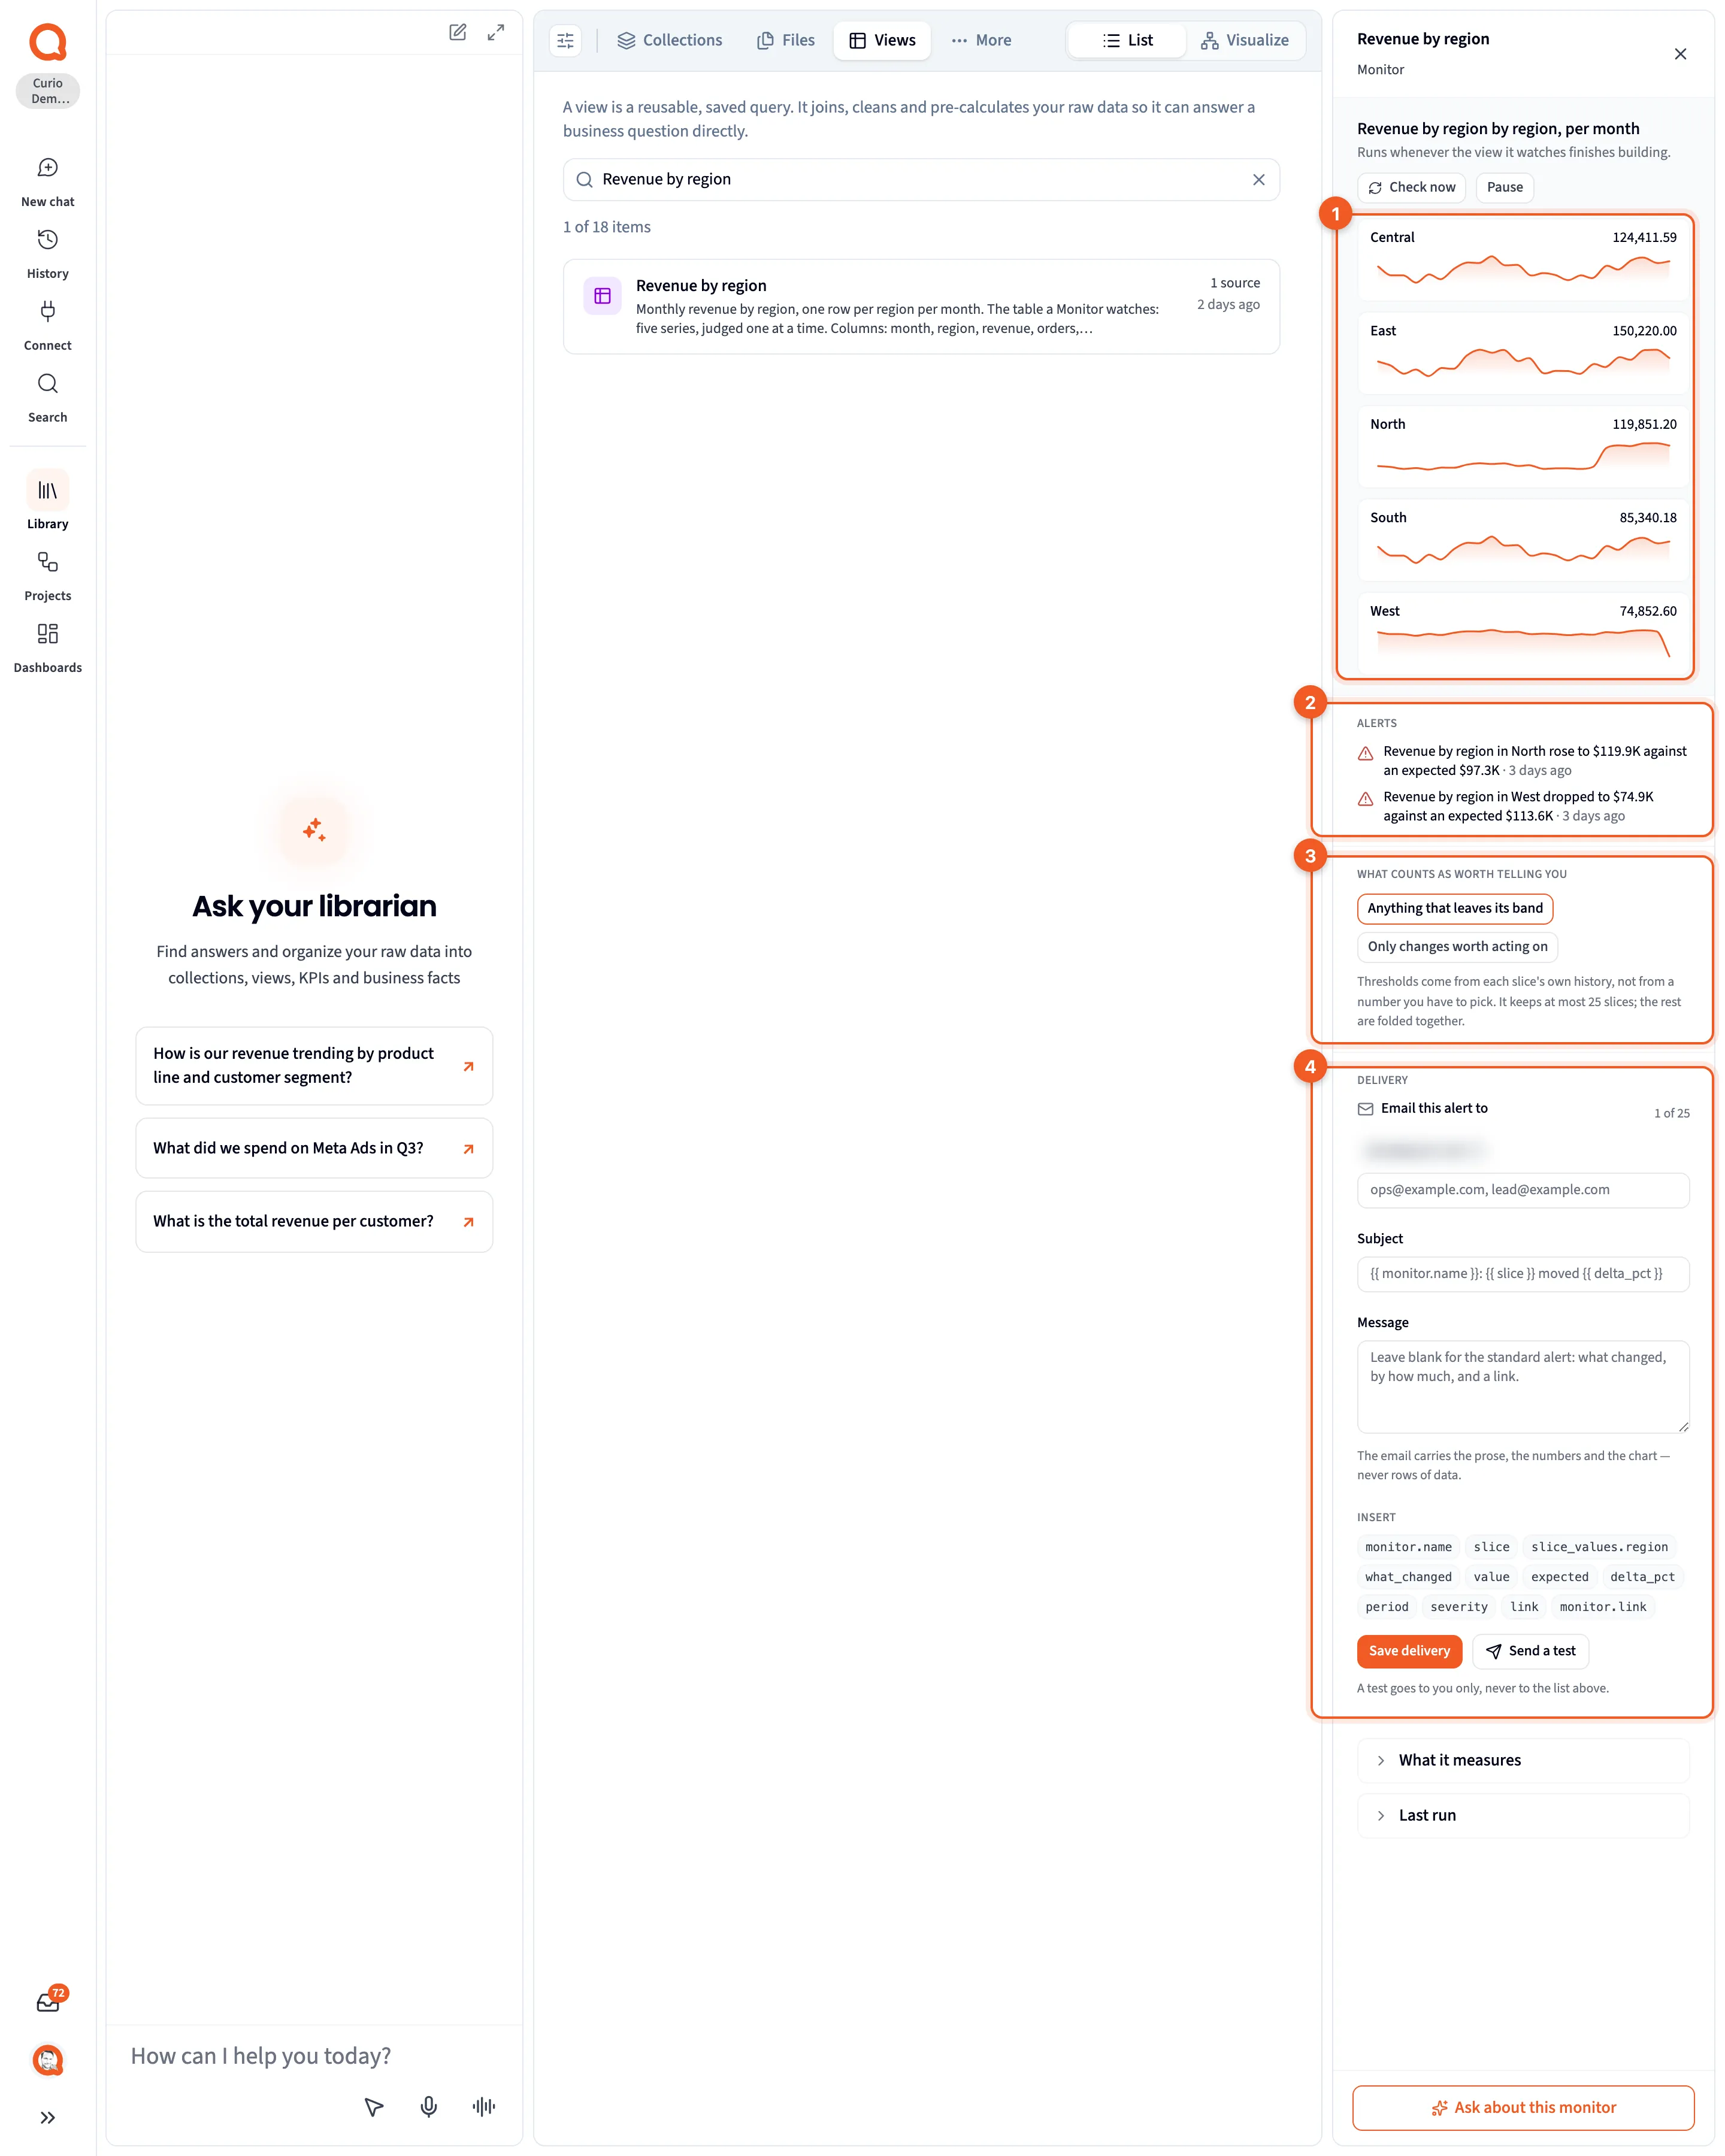
- The slices: a trend line for each slice, biggest movers first.
- Alerts: what the monitor has flagged.
- What counts as worth telling you: how sensitive it is.
- Delivery: who gets each alert by email, and what the email says.
At the top, a line says what the monitor watches and how it’s split, with its status and when it last checked.
- Check now runs the monitor straight away, then says how many slices it checked and how many alerts it raised.
- Pause stops the monitor from running or alerting until you Resume it.
Each slice card shows the latest value, its change, a trend line and the slice’s usual value. Alerts lists what the monitor has raised. An empty list is normal, because a quiet monitor only speaks when a slice leaves its band.
Under What counts as worth telling you, choose Anything that leaves its band or Only changes worth acting on. Your choice saves as soon as you click, and it applies to every slice.
Delivery
Section titled “Delivery”Every alert lands in the Inbox. Delivery also emails it to the people on this monitor’s own list, so each monitor can reach different people.
- Email this alert to: up to 25 addresses. You can paste several at once, separated by commas. While the list is empty, alerts only appear in the Inbox. An address Querri can’t send to is dropped.
- Subject and Message: the email’s wording. Leave both blank for the standard alert, which says what changed, by how much, with a link. Insert adds a placeholder, like the monitor’s name, the slice or the change.
- Save delivery: saves the list and the wording. Alerts from then on are emailed.
The email carries the summary, the numbers and the chart, never rows of data. Each person on the list gets their own copy.
Send a test sends a real email: one sample alert, to your own address. Nobody on the list gets it. It uses the standard alert wording, not your Subject and Message.
Only people who can edit the view a monitor watches can change its list, save it or send a test. Everyone else sees the list with the addresses masked.
Folded at the bottom, What it measures shows the monitor’s SQL, and Last run shows how its last run went.
Something changed alerts
Section titled “Something changed alerts”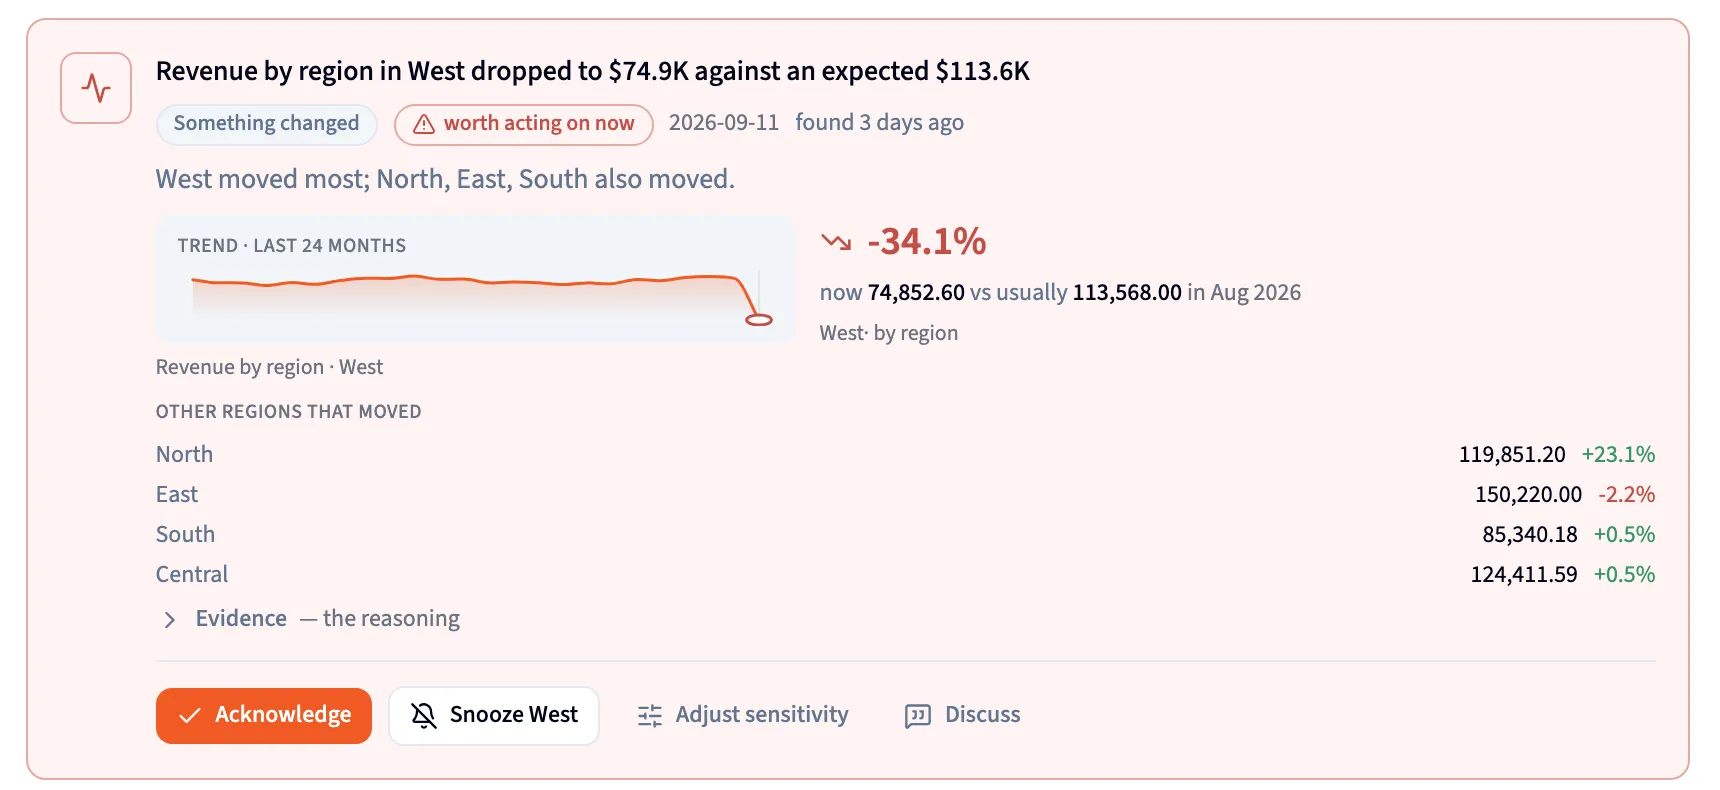
- How serious: worth acting on now or keep an eye on this.
- Now against usual: the latest value, the usual value, and the period.
- Other slices that moved: up to five, largest first.
- Acknowledge: mark the alert handled.
When a slice really moves, a Something changed card lands in your Inbox, and everyone on the monitor’s delivery list gets an email. Its headline names the monitor and the slice, and says whether the value dropped or rose against what was expected. The card’s buttons:
- Acknowledge marks the alert handled and changes nothing else. The card leaves the list the next time the Inbox loads.
- Snooze and the slice’s name, such as Snooze West, silences that slice for 7, 30 or 90 days. Every other slice keeps alerting.
- Adjust sensitivity offers the same two choices as the panel, for every slice.
- Discuss opens Librarian chat about the alert, which uses a credit.
An alert tells you which slice moved, not why.
Not the same as
Section titled “Not the same as”Monitor Usage in Settings is about credits, not monitors (see Monitor Usage). Whether a scheduled project ran shows in that project’s Data Flow panel. See The Data Flow.